- HOME
- FE EXAM
- PE EXAM
- DESIGN TOOLS
- COURSES
- STORE
- ABOUT
- CONSULTING
![]()
Engineering Pro Guides is your guide to passing the Mechanical & Electrical PE and FE Exams
Engineering Pro Guides provides mechanical and electrical PE and FE exam technical study guides, practice exams and much more. Contact Justin for more information.
Email: contact@engproguides.com
EXAM TOOLS
Psychrometrics (8 of 80 Problems)
One of the most important tools for the potential PE Exam test taker is the psychrometric chart. Understanding this chart and how to navigate the chart will definitely be a huge advantage to the test taker.
by Justin Kauwale, P.E.
Introduction
This section focuses on the skills and concepts related to the Psychrometric Chart. The Psychrometric Chart is a key tool used by HVAC & Refrigeration engineers in many situations. It is used in calculating cooling loads and selecting mechanical equipment like enthalpy wheels, heat exchangers (air), air handlers and fan coils. Psyhcrometrics counts for 8 questions on the Mechanical HVAC & Refrigeration PE exam. .
This guide focuses on constant atmospheric pressure at sea level, which is the most common situation encountered by most Mechanical Engineers in the HVAC field. However, if a question indicates a different pressure or extreme temperatures, then please refer to ASHRAE website for required Psychrometric Charts.
The topics under NCEES are 1. Heating/Cooling processes and 2. Humidification/dehumidification processes. Each of these topics will be briefly discussed on this page below.
Psychrometric Chart
The Psychrometric Chart describes the various properties (Dry Bulb Temperature, Wet Bulb Temperature, Enthalpy, Humidity Ratio, Relative Humidity and Specific Volume) of moist air. Moist air is defined as an air-water mixture. Moist air on a psychrometric chart ranges from Dry Air to Saturated Air.
The psychrometric char does not account for variations in pressure. As you can see, pressure is not shown on any axes, because it is constant. For the PE exam and for this guide, it is assumed that the psychrometric chart is based on atmospheric pressure (14.696 psia or 1 atm or 29.921 in. Hg). The psychrometric chart for the PE exam also only shows the typical temperatures encountered by a typical HVAC and Refrigeration Engineer.
Now that you understand the basics of a psychrometric chart, we will now go into detail on the following (3) Pscyhrometric Chart Topics:
Now that you understand the basics of a psychrometric chart, we will now go into detail on the following (3) Pscyhrometric Chart Topics:
- Air Properties on the Psychrometric Chart: What does each property tell of the air-water mixture?
- Movement on the Psychrometric Chart: What causes each type of movement on the chart (Right to Left, Up and Down)
- Typical Psychrometric Questions: Mixtures of Moist Air, Humidification/Dehumidification, Heating/Cooling Questions
Psychrometric Chart - Properties
The psychrometric chart as previously discussed, graphically shows the theromdynamic properties of Moist Air (air-water mixture, humid air, etc.).
- Dry Bulb Temperature:This is the temperature most people are familiar with, as they are always shown on thermometers and thermostats. It is called dry because the temperature is not affected by the moisture in the air.
- Wet Bulb Temperature: This temperature takes into account the moisture in the air. A wet bulb temperature that is equal to the dry bulb temperature, indicates saturated air. A wet bulb temperature much lower than the dry bulb temperature is an indication of dry air.
- Relative Humidity: Relative humidity is the ratio of the amount of water vapor in the air mixture - compared to the maximum amount of water vapor the air can hold at that dry bulb temperature. For example, an air mixture at 100% relative humidity is shown on the saturation curve because the amount of water vapor in the air mixture is equal to the maximum amount. Dry air is shown as the x-axis, which has a relative humidity of 0%, since there is no water vapor in the air mixture.
- Humidity Ratio: This property describes the amount of water content in the air, expressed as the water vapor per unit weight of dry air[lbm of water vapor/lbm or air] or [kg of water vapor/kg of air]. Sometimes the humidity ratio is expressed as grains of water vapor per 1 lbs of dry air. Symbol = [W].
- Enthalpy:The amount of energy in moist air [Btu/lb of dry air]. Symbol = [h]
- Specific Volume:The cubic feet of the mixture per pound of dry air.[ft^3/lb]
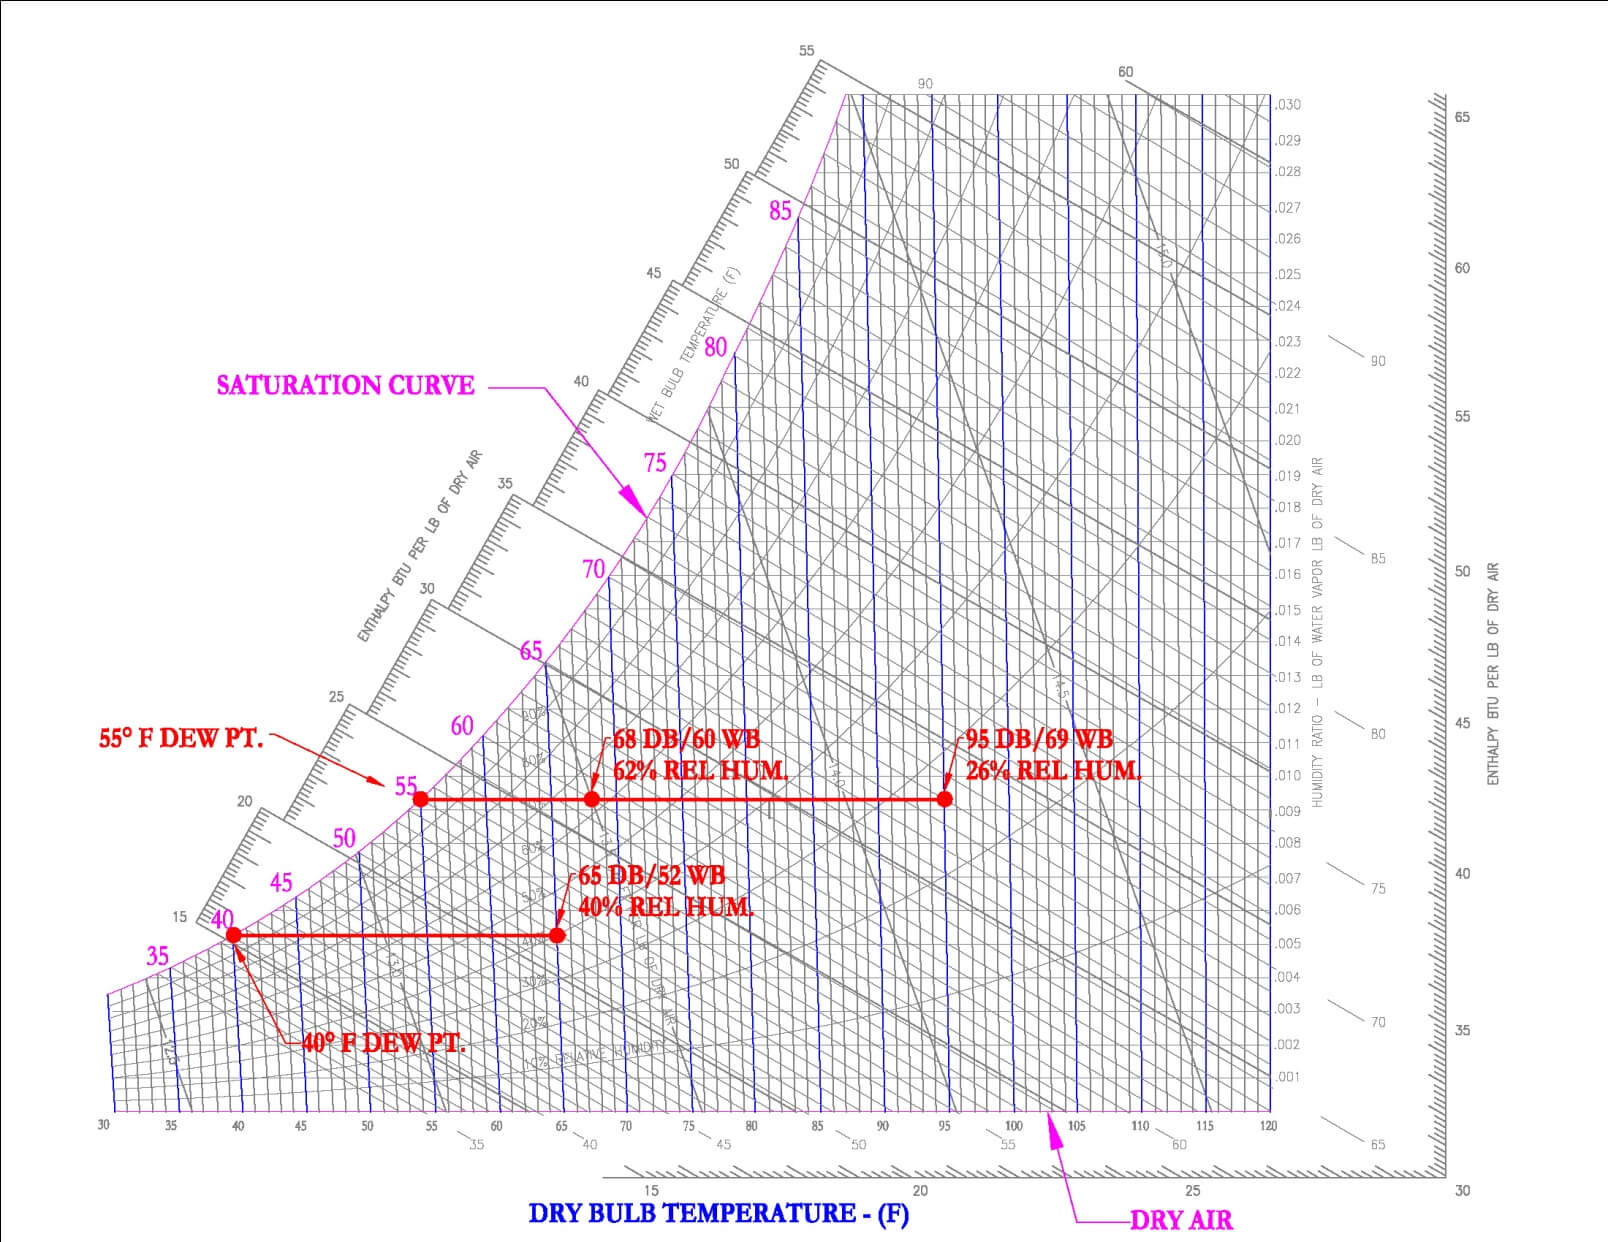
There are also a couple of implicit properties that are shown on the psychrometric chart, including the dew point, which can be found by first finding the point on the graph and moving horizontally to the saturation curve./
Psychrometric Chart
The Psychrometric Chart describes the various properties (Dry Bulb Temperature, Wet Bulb Temperature, Enthalpy, Humidity Ratio, Relative Humidity and Specific Volume) of moist air. Moist air is defined as an air-water mixture. Moist air on a psychrometric chart ranges from Dry Air to Saturated Air.
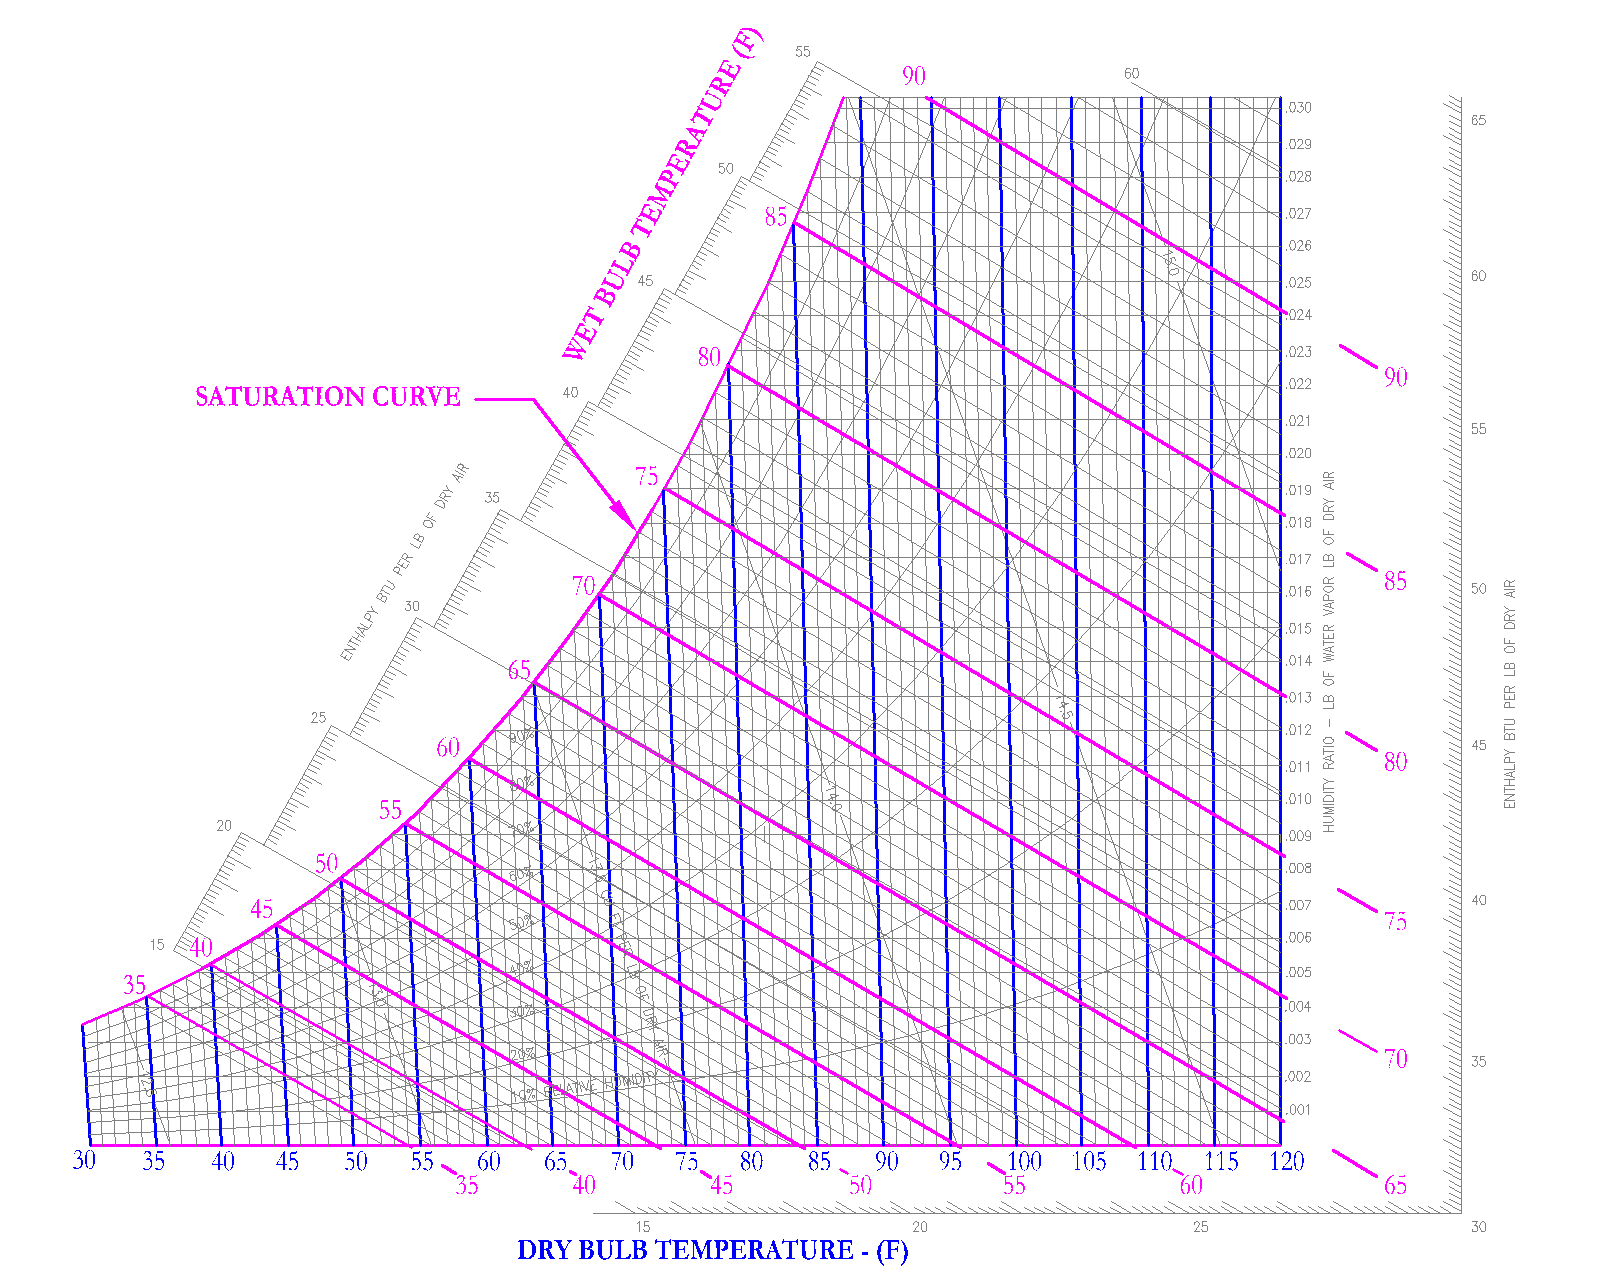
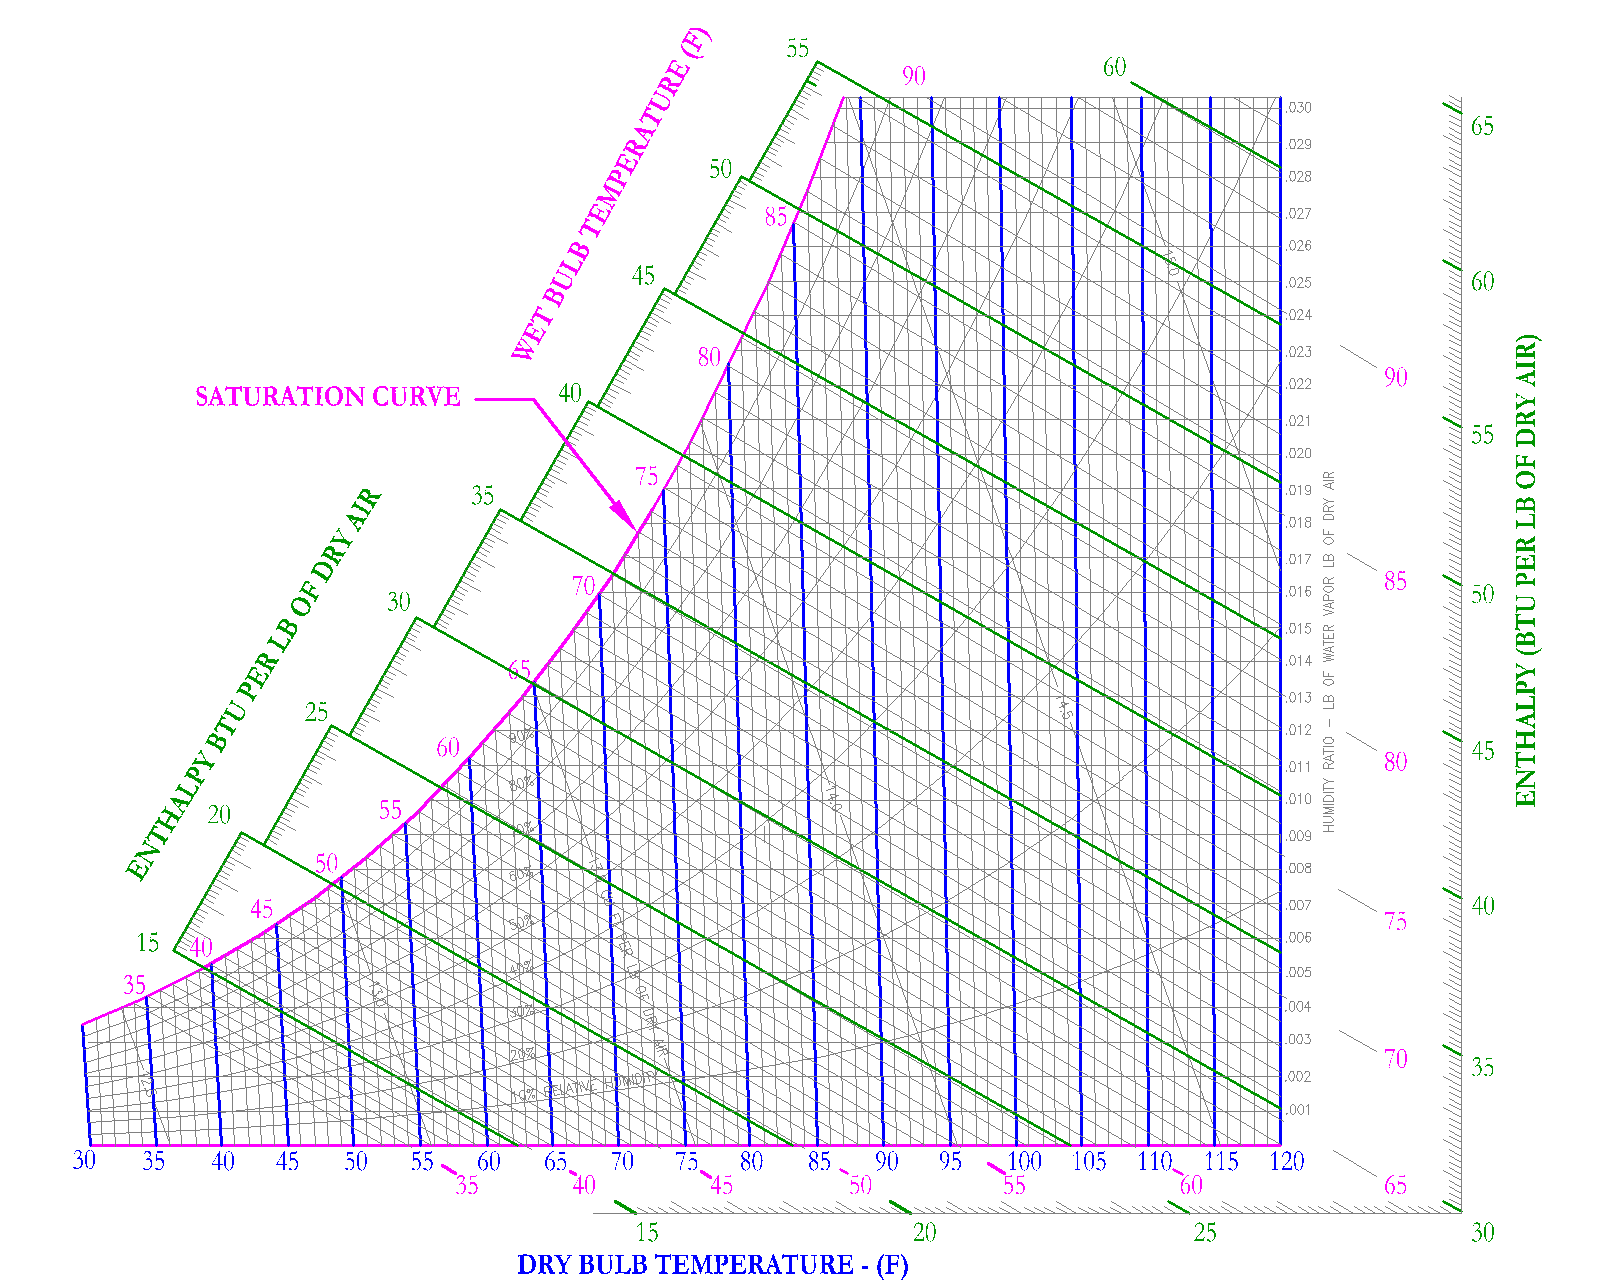
Dry air is defined as having no water vapor and is located on the X-axis of the psychrometric chart. Saturated air is defined as an air-water mixture at equilibrium between the liquid and vapor phase. Saturated air is moist air in balance with its liquid and vapor phases. At saturation, air cannot hold any more moisture. It is the extreme opposite of dry air. This saturated air is defined by the exponential curve, called the saturation curve, which is clearly shown on the below figure
The psychrometric chart does not account for variations in pressure. As you can see, pressure is not shown on any axes, because it is constant. For the PE exam and for this guide, it is assumed that the psychrometric chart is based on atmospheric pressure (14.696 psia or 1 atm or 29.921 in. Hg). The psychrometric chart for the PE exam also only shows the typical temperatures encountered by a typical HVAC and Refrigeration Engineer.
Now that you understand the basics of a psychrometric chart, we will now go into detail on the following (3) Pscyhrometric Chart Topics:
- Air Properties on the Psychrometric Chart: What does each property tell of the air-water mixture?
- Movement on the Psychrometric Chart: What causes each type of movement on the chart (Right to Left, Up and Down)
- Typical Psychrometric Questions: Mixtures of Moist Air, Humidification/Dehumidification, Heating/Cooling Questions
Psychrometric Chart - Properties
Psychrometric Chart – Properties: The psychrometric chart as previously discussed, graphically shows the following thermodynamic properties of Moist Air, 1) Dry Bulb Temperature, 2) Wet Bulb Temperature, 3) Relative Humidity, 4) Humidity Ratio, 5) Enthalpy, 6) Specific Volume and 7) Dew Point. If any of the two above properties are known of an air mixture, then the five other corresponding properties can be found. The following sections go into detail on each of the thermodynamic properties. It is the intent of these sections for the reader to gain an understanding of the concepts and to grasp the meaning of each property.
- Dry Bulb Temperature:This is the temperature most people are familiar with, as they are always shown on thermometers and thermostats. It is called dry because the temperature is not affected by the moisture in the air.
- Wet Bulb Temperature: This temperature takes into account the moisture in the air. A wet bulb temperature that is equal to the dry bulb temperature, indicates saturated air. A wet bulb temperature much lower than the dry bulb temperature is an indication of dry air.
- Relative Humidity: Relative humidity is the ratio of the amount of water vapor in the air mixture - compared to the maximum amount of water vapor the air can hold at that dry bulb temperature. For example, an air mixture at 100% relative humidity is shown on the saturation curve because the amount of water vapor in the air mixture is equal to the maximum amount. Dry air is shown as the x-axis, which has a relative humidity of 0%, since there is no water vapor in the air mixture.
- Humidity Ratio: This property describes the amount of water content in the air, expressed as the water vapor per unit weight of dry air[lbm of water vapor/lbm or air] or [kg of water vapor/kg of air]. Sometimes the humidity ratio is expressed as grains of water vapor per 1 lbs of dry air. Symbol = [W].
- Enthalpy:The amount of energy in moist air [Btu/lb of dry air]. Symbol = [h]
- Specific Volume:The cubic feet of the mixture per pound of dry air.[ft^3/lb]
There are also a couple of implicit properties that are shown on the psychrometric chart, including the dew point, which can be found by first finding the point on the graph and moving horizontally to the saturation curve./
Dry Bulb
This is the temperature most people are familiar with, since the Dry Bulb temperature is the temperature always shown on thermometers and thermostats. It is called dry because the temperature is not affected by the moisture in the air. It is a direct indication of the amount of sensible heat in the air at the given conditions.
In practice, design dry bulb temperatures for typical offices range from 72 to 75 F. Also typical dry bulb temperatures of cool supply air from an air handling coil ranges from 52 to 55 F. For the purpose of the PE Exam, United States Customary Units or USCS are used. Please do not spend additional time on studying conversions to International System of Units (SI).
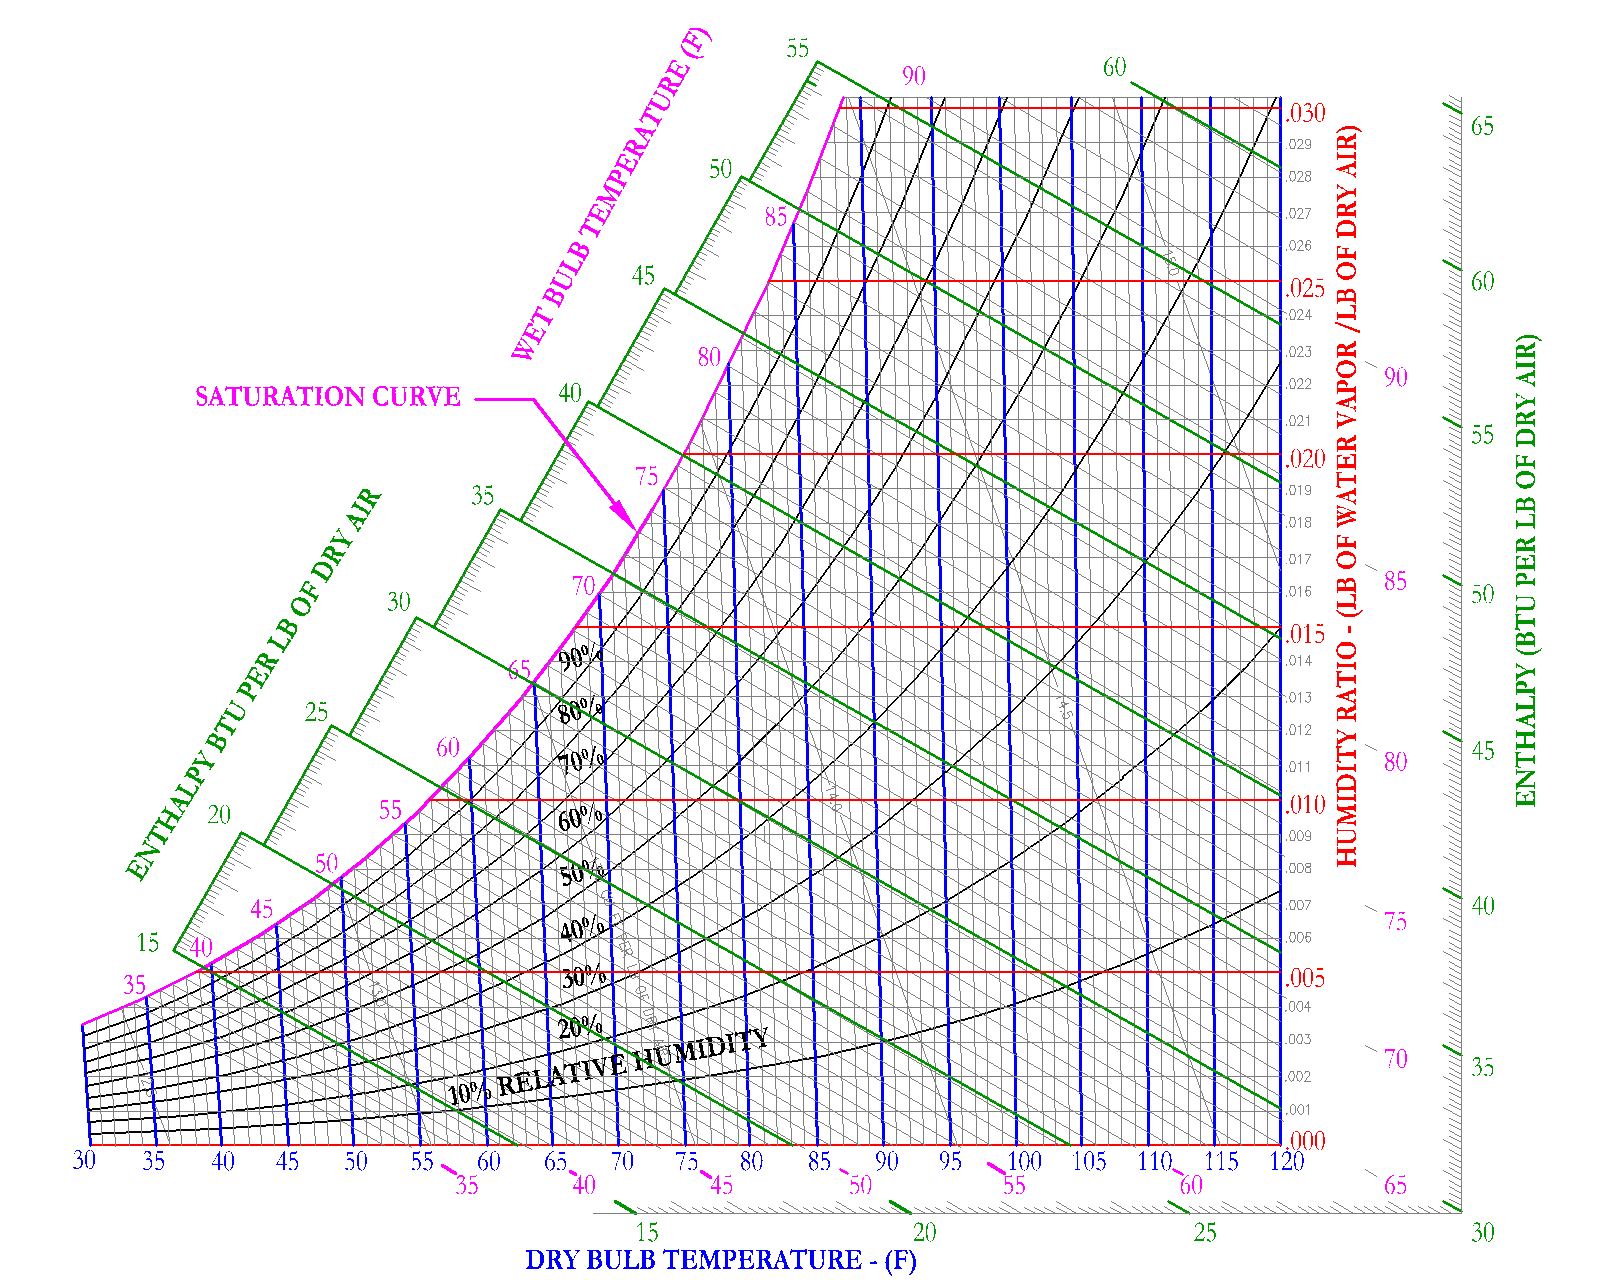
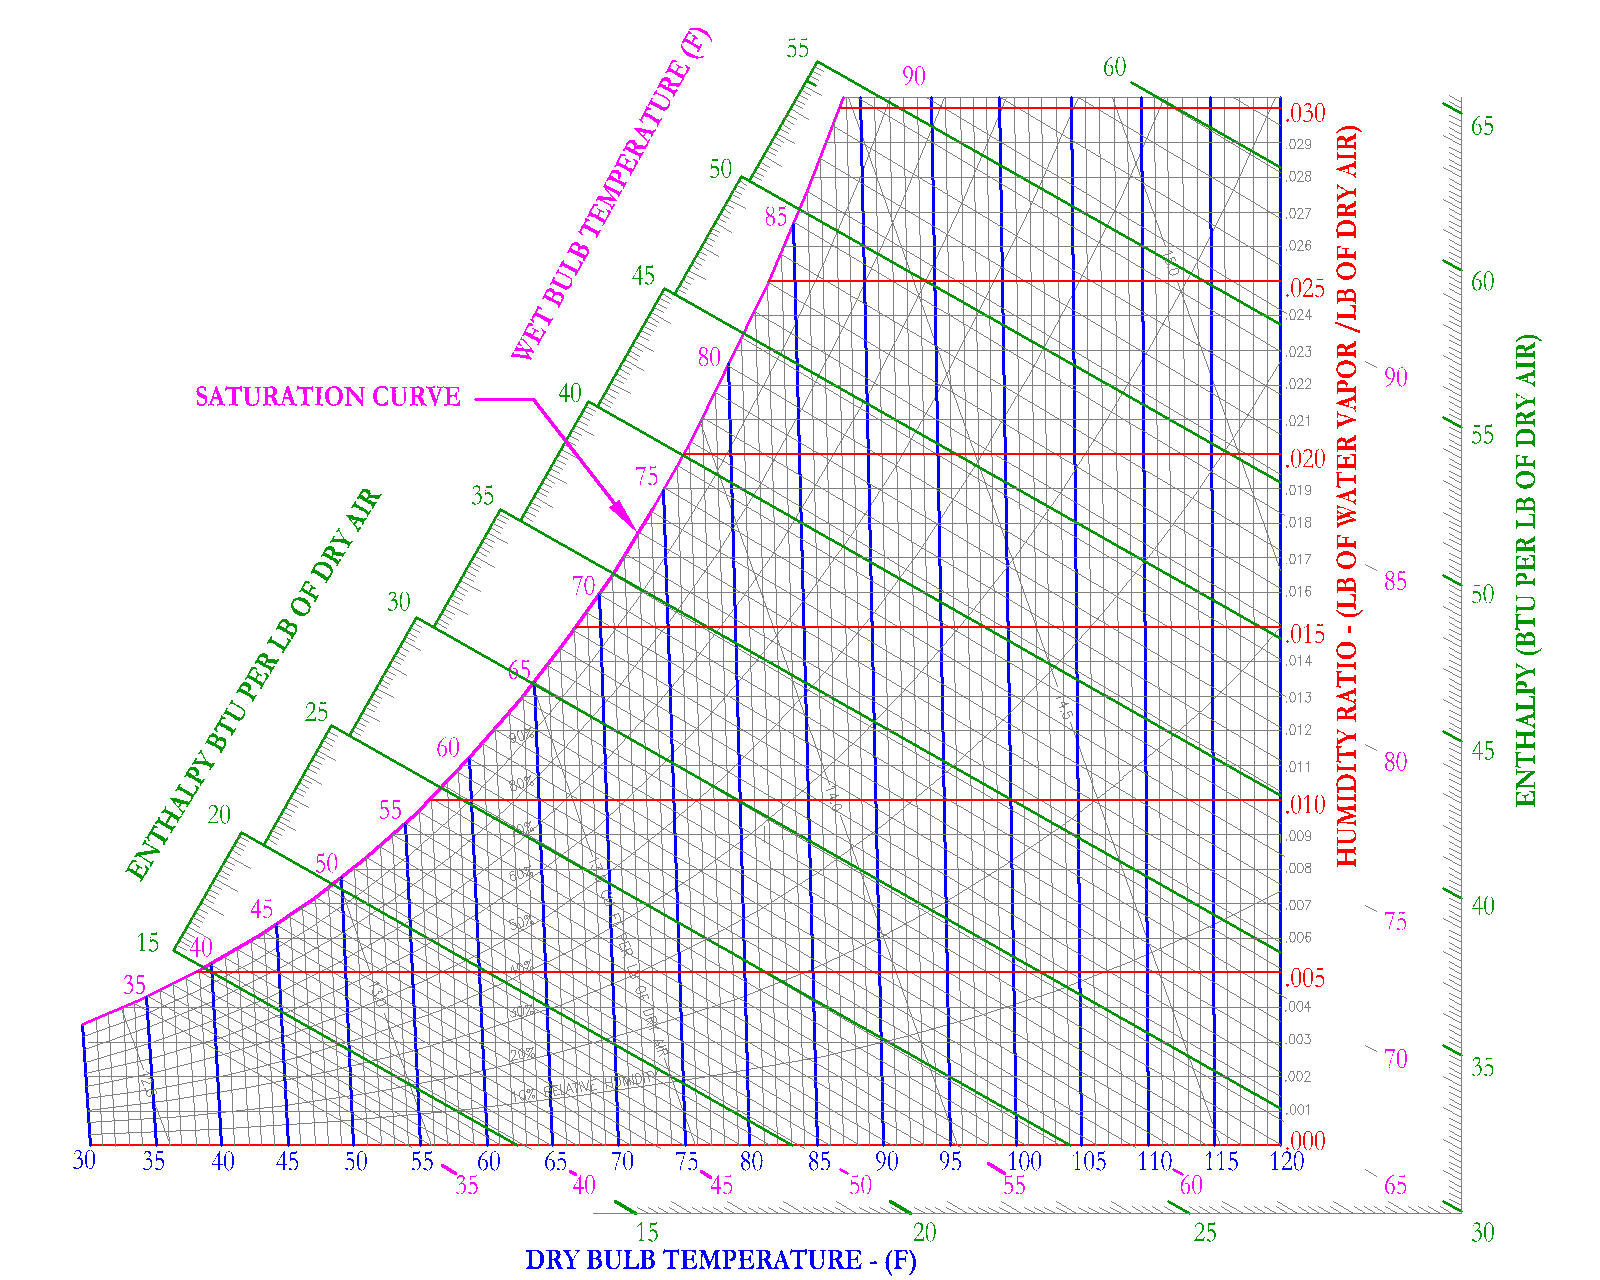
On the psychrometric chart, the dry bulb temperature is shown by vertical, parallel lines, below in blue.
Wet Bulb Temperature
This property takes into account the moisture in the air. The wet bulb temperature in conjunction with the dry bulb temperature is a direct indication of the amount of moisture in the air.
The wet bulb temperature is measured through the use of a sling psychrometer, which consists of a thermometer covered by a wetted cloth wick. The psychrometer is swung and if the air is dry, then the wetted cloth wick will begin to evaporate. The energy lost to evaporation cools the wetted cloth wick, which will in turn decrease the temperature reading.
If the air is saturated, then the wetted cloth wick will not evaporate and the wetted cloth wick will read the same temperature as the air. The drier the air, the more evaporation will take place, which will cool the wetted cloth wick and will decrease the wet bulb temperature reading. Thus the difference between the dry bulb temperature and the wet bulb temperature describes whether or not the air is humid or dry.
For example, wet bulb temperatures significantly lower than the dry bulb temperature is an indication of dry air. A wet bulb temperature near the dry bulb temperature describes air that is nearly saturated.
On the psychrometric chart shown in the below figure, the wet bulb temperature lines originate from the intersection of the corresponding dry bulb temperature and the saturation curve. The wet bulb lines are shown in pink. If you follow the dry bulb lines shown in blue from the dry air line up to the saturation curve, you can see that the wet bulb increases until it equals the dry bulb temperature. When the wet bulb temperature equals the dry bulb temperature, then the air is saturated.
Relative Humidity
Relative humidity is the ratio of the amount of water vapor in the air mixture - compared to the maximum amount of water vapor the air can hold at that dry bulb temperature. For example, an air mixture at 100% relative humidity is shown on the saturation curve because the amount of water vapor in the air mixture is equal to the maximum amount. Dry air is shown as the x-axis, which has a relative humidity of 0%, since there is no water vapor in the air mixture.
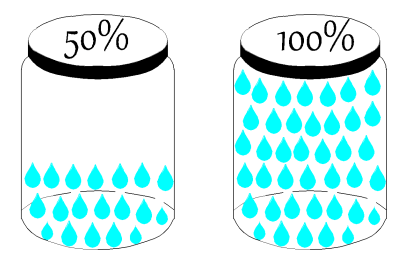
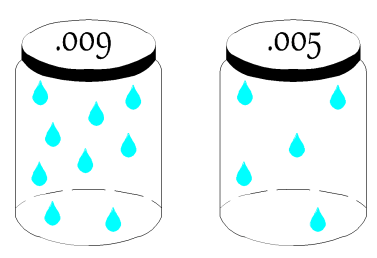
The figure below shows two equal volumes of air in a jar. One jar or volume of air contains the maximum amount of water it can hold, as illustrated as a completely filled jar of water vapor droplets. The other jar is showing only half the amount of water vapor droplets and therefore has a relative humidity of 50%.
Humidity Ratio
This property describes the amount of water content in the air, expressed as the water vapor per unit weight of dry air [(lbm of water vapor)/(lbm of dry air)] or [(kg of water vapor)/(kg of dry air)]. Sometimes the humidity ratio is expressed as [(grains of water vapor)/(1 lb of dry air)], where the symbol of these units is [W]. Another term used for humidity ratio is absolute humidity.
Air with a humidity ratio of .009 [(lbm of water vapor)/(lbm of dry air)], as shown graphically by (9) water vapor droplets. The jar on the right, holding a volume of air, has a humidity ratio of .005 [(lbm of water vapor)/(lbm of dry air)], as illustrated by (5) water vapor droplets in the same volume of air. Mass can be interchanged with volume, if it is assumed that the density is constant. Thus, the jar with the larger number of droplets for the same volume of air has a higher humidity ratio.
Enthalpy
Enthalpy is the summation of the amount of sensible and latent energy in the air. [Btu/lb of dry air]. Enthalpy is represented by the symbol = [h]. In HVAC, enthalpy is used to determine the amount of energy that is in moist air. It is important to recognize that on the psychrometric chart, enthalpy is shown as downward sloping lines in green. These enthalpy lines are closely aligned (but not completely) to the downward sloping wet bulb lines. Enthalpy shall be covered more closely in the following sections. This section is meant to introduce the term and its role on the psychrometric chart to the reader.
Specific Volume
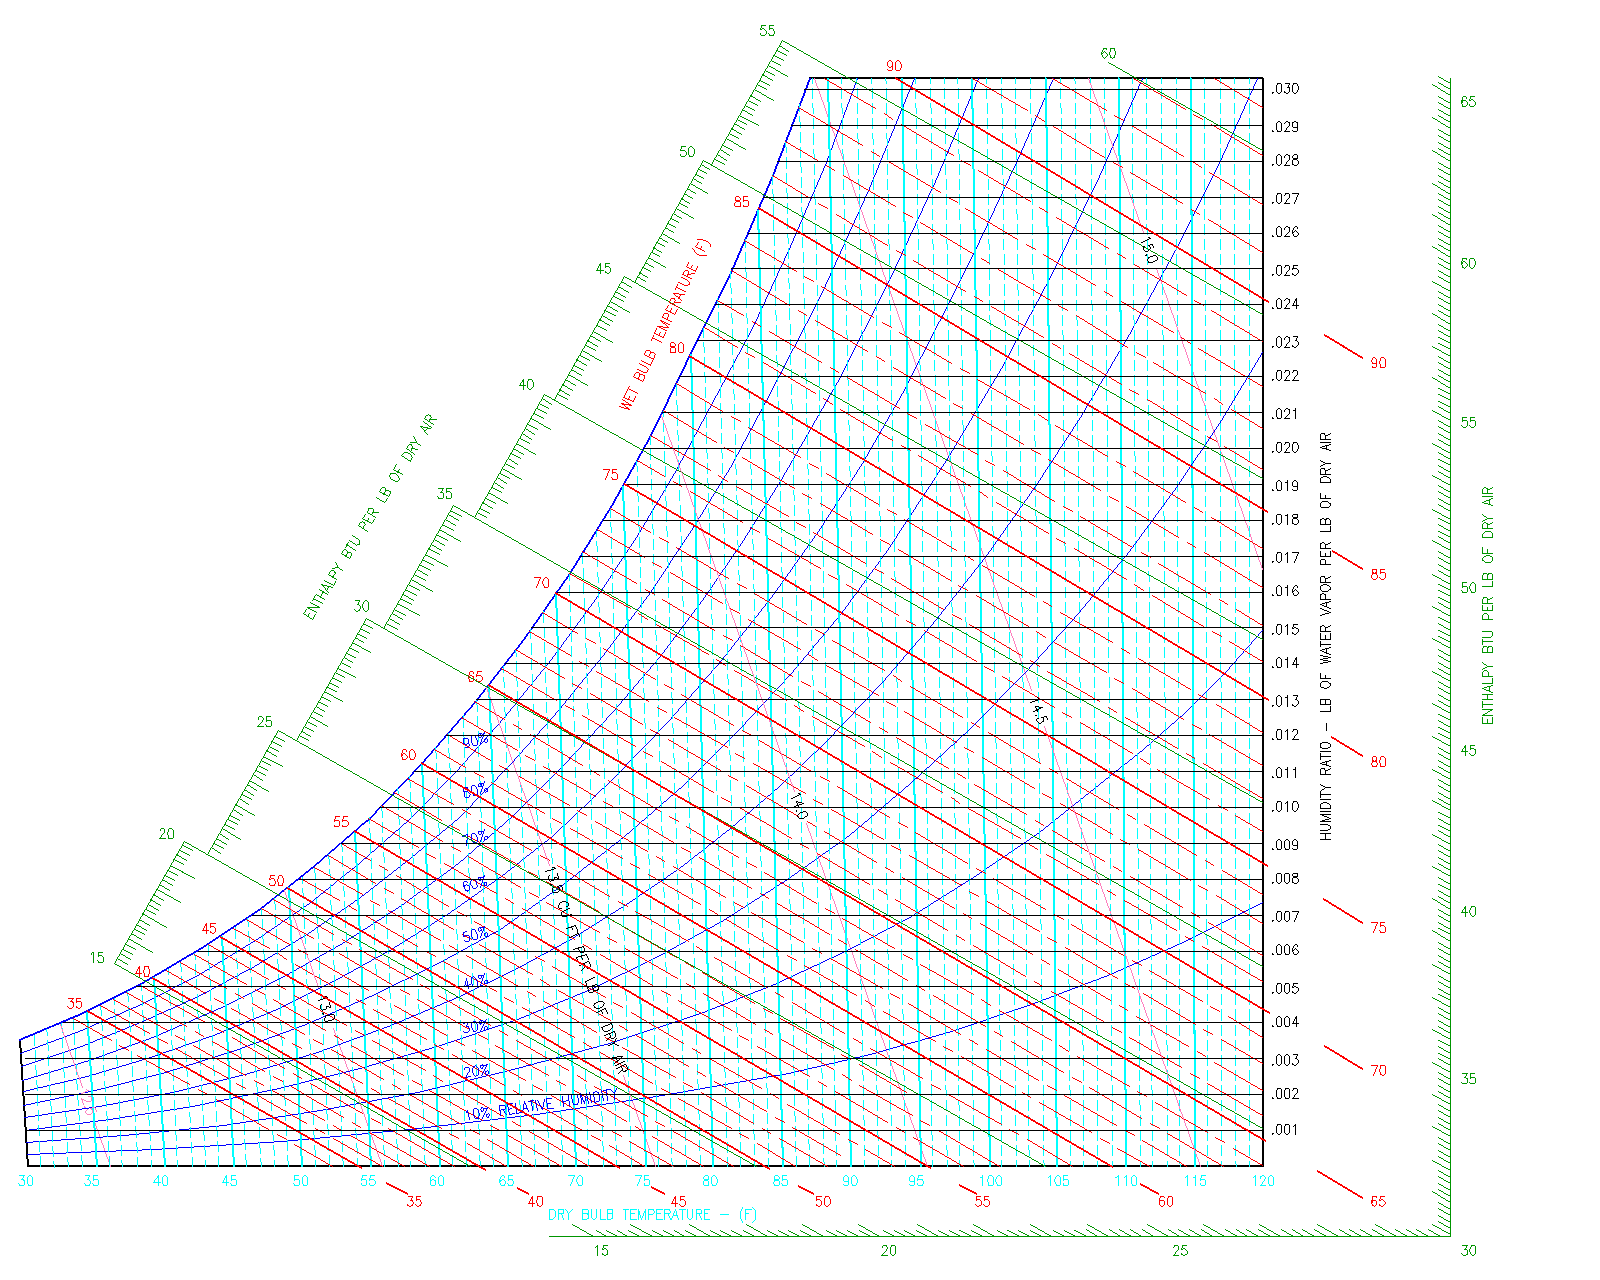
Specific volume is used to define the volume taken up by moist air at specific conditions. The units are defined as [ft3/lb] and the symbol for specific volume is [v]. On the psychrometric chart, specific volume is shown as downward sloping lines, shown in red on Figure 10.
For example, air at 1 atmosphere, 68 F DB and 60 F WB would have a specific volume of 13.5 ft3/lb and air at 1 atmosphere, 88 F DB and 66 F WB would have a specific volume of 14.0 ft3/lb. It is important to note that specific volume lines are typically shown in 0.5 increments, it is up to the user of the Psychrometric Chart to extrapolate or interpolate to get more accurate specific volume measurements.
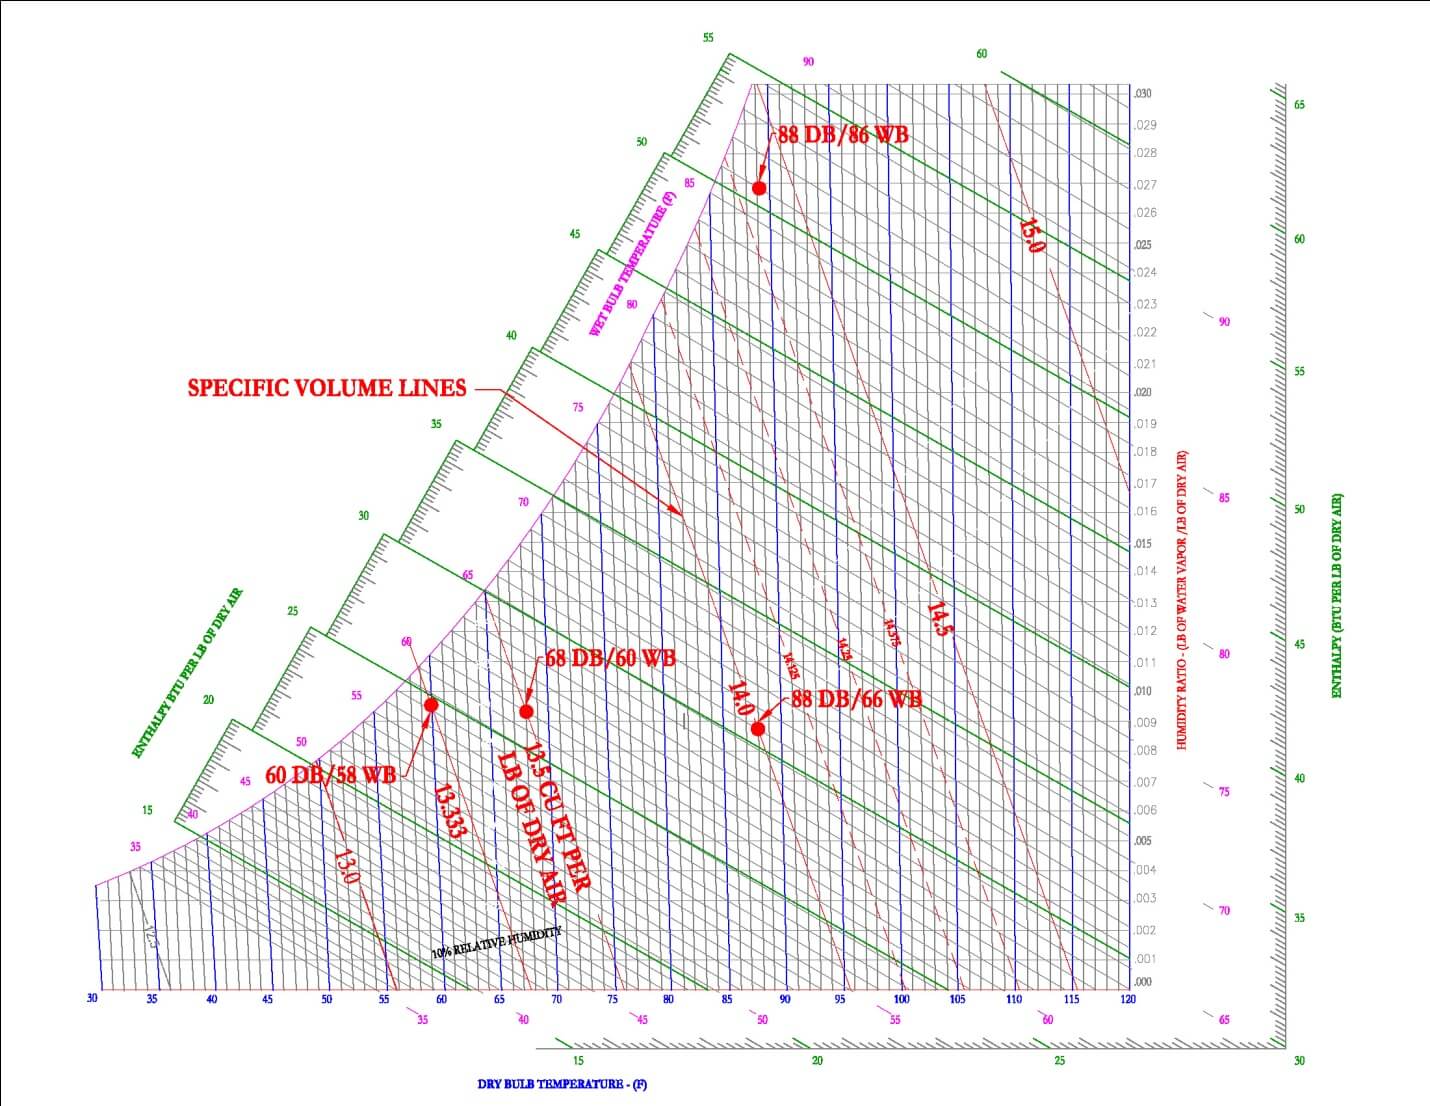
Most often air at 60 DB/58WB is used as standard conditions, this results in a specific volume of 13.33 [ft3/lb]. Density is simply the inverse of specific volume. At standard conditions, the density of air is 1/13.33 [ft3/lb] or 0.075 [lb /ft3].
Dew Point
The dew point can be found by first finding a certain condition on the graph and moving horizontally left to the saturation curve. This is the temperature at which the air mixture must be cooled in order for condensation to first occur. In HVAC, this skill is often used to determine under what conditions condensation will occur on a window, pipe, duct or equipment surface. One example is the fairly new HVAC system called Chilled Beams. Chilled beams is the system of cooling spaces through the use of pipes containing cool water suspended below a ceiling, the pipes are often situated into a passive (no fan) or active (fan) heat exchanger. As warm air passes over the chilled beam, it cools and falls to the floor, thereby cooling the space below. Condensation is a concern because if the chilled beam is at a temperature below the dew point of the air, then as the air hits the coil, water may condense on the chilled beam and drip into the space.
Movement on Psychrometric Chart
Sensible Heating/Cooling
Sensible heating and cooling is defined as the removal or addition of heat to an air mixture, with no effect on the moisture content. Its sole effect is on the increase or decrease of the dry bulb temperature.
On a Psychrometric Chart, sensible heating and cooling is shown as a horizontal line. It is horizontal because the amount of water vapor in the air is not changed, thus the Humidity Ratio remains the same. A horizontal movement increases or decreases the dry bulb temperature. As the dry bulb temperature increases with sensible heating, the air's capacity to hold water also increases. The opposite is true with sensible cooling. In addition, sensible heating is shown on the graph below to decrease relative humidity, while sensible cooling increases relative humidity.
Latent Heating/Cooling
Latent heat energy is the amount of energy required to produce a phase change, water (liquid) to water (vapor).
Latent heating and cooling is defined as the removal or addition of moisture (water vapor) to an air mixture. Latent heating is more commonly known as humidification and latent cooling is known as dehumidification. In HVAC, common latent heat sources include people, equipment and outdoor air.
Sensible Heat Ratio
The sensible heat ratio (SHR) is used when there is diagonal movement on the psychrometric chart. Diagonal movement would indicate both sensible heating/cooling and latent heating/cooling. SHR is defined as the ratio of sensible heat to total heat.
Mixing of Two Airstreams
A common skill is determining the output conditions of the mixture of two air streams. The important concept to first understand is that the output conditions of the mixed airstream will be most similar to the air stream that has the most volumetric flow rate.
For example, if 2,000 CFM of 80 F DB/65 F WB is mixed with 100 CFM of 50 F DB/45 F WB, then the resulting mixed air conditions will be most similar to the 80 F DB/65 F WB air. This seems obvious but often times in test situations, the test taker may forget the obvious and simply rely on the calculations, which can be mistakenly entered into a calculator. This realization, will give the engineer an insight into the most probable answer of the four possible choices.
The second concept is that the dry bulb and humidity ratios change linearly. For example, if 2,000 CFM of 80 F DB is mixed with 2,000 CFM of 50 F DB, then the resulting temperature will be located equally in between 80 F DB and 50 F DB. The resulting temperature will be 65 F DB.
For example, if 3,000 CFM of 80 F DB is mixed with 1,000 CFM of 50 F DB, then the resulting temperature will be 72.5 F DB, corresponding to the location on the graph indicated by 75% of the total mixture is from 80 F DB air.