- HOME
- FE EXAM
- PE EXAM
- DESIGN TOOLS
- COURSES
- STORE
- ABOUT
- CONSULTING
![]()
Engineering Pro Guides is your guide to passing the Mechanical & Electrical PE and FE Exams
Engineering Pro Guides provides mechanical and electrical PE and FE exam technical study guides, practice exams and much more. Contact Justin for more information.
Email: contact@engproguides.com
EXAM TOOLS
Thermodynamics (4 of 80 Problems)
by Justin Kauwale, P.E.
Introduction
Thermodynamics accounts for approximately 4 questions on the HVAC & Refrigeration Mechanical PE exam. .
Thermodynamics includes the principles used in the vapor compression cycle. Also the properties discussed in this section are used in the sections, Heating/Cooling Loads, Equipment, Systems, Psychrometrics and Energy/Mass Balance.
A professional engineer should be able to properly navigate a refrigeration diagram and have a deep understanding of the vapor compression cycle. In addition, this guide also focuses on the (4) main parts of refrigeration systems, which are the evaporator, compressor, condenser and expansion device. The refrigerant used in this cycle is also discussed in this section.
Also introduced in this section are the Thermodynamics properties, pressure, temperature, enthalpy, entropy and specific heat. These properties are used throughout the vapor-compression cycle and also in many other sections on the HVAC & Refrigeration PE exam.
At the end of this section, steam is covered. Steam is used heavily in the HVAC & Refrigeration field for heating. Although there is no specific category in the NCEES outline, you should be familiar with the skills presented in this section since it may appear in a heating question.
The topics under NCEES are 1. Cycles, 2. Properties, 3. Compression processes. Each of these topics will be briefly discussed on this page below.
Thermodynamic Properties
On the exam, you should be able to find thermodynamic properties very easily through the use of your thermodynamic property tables for given fluids, located in your Mechanical Engineering Reference Manual or Schaum’s Thermodynamics for Engineers. These properties are the building blocks for solving the problems on the exam. You should also have a concept of what these properties mean in the real world. These concepts will help to reality check your answers, instead of blindly following the results of your equations. Hopefully, this helps you to catch any math errors and speeds up your elimination of incorrect multiple choice answers.
Pressure
Pressure is one of the two most likely properties that you will start off with in a real world situation, because pressure is a thermodynamic property that is easily measured.

The pressure of a fluid indicates the amount of force per unit area that the fluid imparts on the materials around it. Pressure is typically measured in units of pounds per square inch (psi= lbf/(square inch)) . There are two different types of pressure scales, (1) absolute pressure and (2) gauge pressure. These two pressure scales differ by their 0 reference point. Gauge pressures have a 0-reference point as 1 atm. Thus 0 psig, where the “g” indicates gauge pressure, is equal to 1 atmospheric or 14.7 psia, where the “a” indicates absolute pressure. Most real world applications encountered by practicing engineers will have pressures indicated in gauge pressure. These include pressures measured at the discharge and intake of pumps and fans and the pressures measured at other pieces of equipment like heat exchangers, chillers and cooling towers. The relationship between gauge and atmospheric pressure is shown with the following equation and figure.

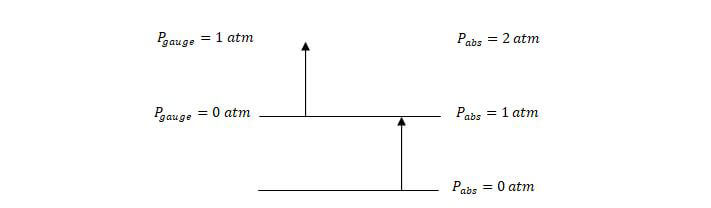
The relationship between gauge and absolute pressures, gauge pressure on the left and absolute pressure is shown on the right. See technical study guide for continuation.
Temperature
Temperature is the second property that you will start off with in a real world situation, because temperature is easy to measure.

This property is the one most people are familiar with, because it is displayed on thermostats and thermometers. Temperature is a direct indication of the amount of heat in the fluid. The United States Customary Systems (USCS) units used for temperature are Fahrenheit and Rankine. Typical Fahrenheit temperatures for chilled water (medium used for water-cooled air conditioning) range from 45 F to 55 F and hot water temperatures range from 120 F to 140 F. The temperature at which water boils is 212 F and water freezes at 32 F.
Rankine temperatures are used when it is necessary to define an absolute temperature scale having only positive values. The conversion between Fahrenheit and Rankine is shown below. When using equations during the exam, ensure that the correct temperature units are used. Always double check the required units for your equation.

Enthalpy
Enthalpy describes the amount of energy in a system. This property is used extensively in the Energy/Power applications. It defines the entering and leaving energy of a fluid through a system. On the exam, enthalpy refers to total enthalpy. Total enthalpy is equal to the internal energy of the fluid plus the energy due to pressure-volume.
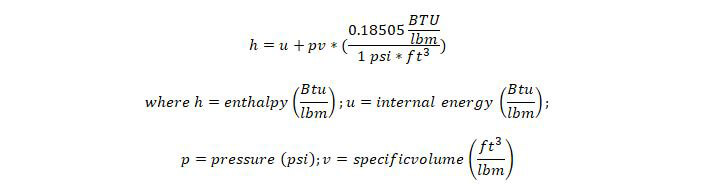
See technical study guide for a continued discussion on Enthalpy.
Entropy
See technical study guide for the section on entropy.
Specific Heat
See technical study guide for the section on Specific Heat.
Refrigerants
Refrigerants are fluids used in the commercial HVAC field to transfer heat from one source to another. For example, in a water cooled chiller, refrigerant is used to remove heat from chilled water and transfer heat to condenser water. Or in a typical residential split air conditioner system, refrigerant is used to remove heat from the indoor air and transfer that heat to the outdoors through the use of a condenser.
The main requirement for a fluid to be classified as a refrigerant is the ability to transfer heat. Refrigerants must also be safe in order to be used for commercial and residential air conditioning purposes. Refrigerants are classified by the following information: (1) Flammability, (2) Toxicity, (3) Global Warming Potential (GWP), (4) Ozone Depleting Potential (ODP) and (5) Operating Pressure. The flammability and toxicity classifications are shown in ASHRAE 15. Be familiar with ASHRAE 15
Refrigerants can be split into four different types, (1) Hydrocarbons, (2) Chlorofluorocarbons, (3) Hydroclurofluorocarbons and (4) Hydrofluorocarbons.
- Hydrocarbons consist of hydrogen and carbon. Some examples of hydrocarbons include methane, ethane, propane and butane. Hydrocarbons like propane and isobutene can be used in vapor compression cycles for refrigeration, but most commonly hydrocarbons are used in the combustion process.
- CFCs consist of carbon, with the chemical addition of chlorine and fluorine. Common CFCs include R-12 and R-11, which were used heavily in air conditioning, vapor compression cycles. Unlike hydrocarbons, CFCs are non-flammable. However, CFCs when improperly handled and released into the atmosphere have been found to deplete the ozone layer. For this reason, CFCs have been scheduled to be phased out and in the United States. In fact, CFCs are no longer used in new air conditioning machines.
- HCFCs consist of hydrogen and carbon, with the chemical addition of chlorine and fluorine. The most common HCFC is R-22, which was used heavily in air conditioning. HCFCs are non-flammable. They are also no longer used in new air conditioning machines in the United States, because they contain the ozone harmful element, chlorine. The Montreal Protocol requires that HCFC's be decreased in consumption and production, until HCFC's are completely phased out in 2030. Two specific HCFC’s, 22 and 142B, have been phased out of new equipment in 2010, with the complete phase out of these refrigerants in 2020 (existing and new equipment).
- HFCs have been substituted for CFCs because they have an ozone depletion potential of zero and contain no chlorine. HFCs are also being substituted for HCFCs because they are currently the most efficient refrigerants that do not harm the ozone, since they do not contain chlorine. However, HFCs are also planned to be substituted in the future because of the greenhouse gases that are emitted.

Ozone Depleting Potential
Ozone Depleting Potential [ODP]: The ODP is an index developed to identify how damaging a substance is to the ozone. The reference point from which all substances are compared is CFC-11. CFC-11 is assumed to have an ODP of 1, more damaging chemicals have a higher ODP and less damaging chemicals have a lower ODP. A summary of chemicals and their ODP is shown in the table below. Refrigerants with chlorine have a higher ODP. It is estimated that each chlorine atom destroys 100,000 ozone molecules.

Global Warming Potential
Global Warming Potential [GWP]: The GWP is an index developed to identify the potential for a substance to prevent infrared radiation from leaving the earth's atmosphere. The reference point, from which all substances are compared, is carbon dioxide. CO2 is assumed to have a GWP of 1, chemicals with a higher potential to contribute to global warming have a higher GWP and those with a lower potential have a lower GWP. A summary of chemicals and their GWP is shown in the table below.

Boiling Points
Low pressure refrigerants boil at a lower temperature, high pressure refrigerants condense at a higher temperature.
One key principle that must be understood for Refrigeration is the relationship between the boiling/condensing point of a fluid, in this case a refrigerant, and the temperature and pressure of the refrigerant. A refrigerant liquid’s boiling point is a function of the vapor pressure of the refrigerant vapor that is in equilibrium with the refrigerant liquid. If the pressure is low, then there is a smaller force acting upon the refrigerant liquid, thus it will take a lower temperature to boil the refrigerant liquid. For example, water at a pressure of 1 atmosphere or 14.696 PSI will boil at 212 F. However, if the water was at a pressure of 0.122 PSI, then the water will boil at 40 F.

When a low pressure refrigerant changes from its liquid phase to a gas phase, it can absorb much more heat than if it were to simply increase in temperature. The same is also true when a high pressure refrigerant changes phase from its gas phase to a liquid phase, it release much more heat than if it were to decrease in temperature. The energy required to change the phase of a liquid from a liquid to a gas is called the latent heat of evaporation. The energy released to change the phase of a gas to a liquid is called the latent heat of condensation.
Vapor Compression Cycle
Step 1 - Evaporator
The vapor compression cycle is the primary cycle used in commercial refrigeration systems.
The vapor compression cycle starts at (Step 1) the evaporator, with cold, low-pressure, liquid refrigerant. It absorbs heat and evaporates to a low-pressure gas. Then the gas is (Step 2) Compressed to a high-pressure, high-temperature gas and (Step 3) condensed to a high pressure gas. Finally, the gas is condensed at the (Step 4) expansion device to a cold, low-pressure liquid refrigerant.

Step 1: Evaporator. The first step in the vapor compression cycle is the evaporator, which can also be called a liquid cooler. The evaporator is simply a heat exchanger. Heat is exchanged from the warm medium (air or water) to the cold, liquid refrigerant. The heat gained by the liquid refrigerant causes it to change phases to a refrigerant gas. The refrigerant liquid gains the heat necessary to overcome the latent heat of evaporation, in order to change to a gas. There are two types of evaporators, (1) an air cooled evaporator and (2) a water cooled evaporator. Figure below shows the (1) air cooled evaporator which is most commonly referred to as a direct expansion system. In this evaporator, warm air from an air conditioned space is cooled and redistributed to the space. Also shown in the figure below is the water cooled system, where chilled water return is cooled and supplied to the chilled water distribution system.

The most common system is the direct expansion system. This system is prevalent throughout smaller systems, like those serving residential systems. In this system, the hot air from the space is used to directly evaporate the refrigerant to a hot gas. Note that the hot air from the space is roughly ~75 °F and the refrigerant liquid is typically 40 °F. The 75 °F room air is cooled down to ~55 °F and then distributed back to the space. In a water-cooled system, which is more common for larger commercial systems, chilled water typically at 55 °F is cooled by the evaporator down to ~45 °F. The colder chilled water is then supplied to another heat exchanger, where air is cooled and then distributed to the space.
Besides the two different types of evaporator systems, there are also different types of heat exchangers used in refrigeration. The most common heat exchangers include: (1) Shell and Tube, (2) Tube in Tube and (3) Brazed Plate.
(1) Shell and Tube: This heat exchanger is the most common and consists of copper pipes arranged in a coil that is constructed in a cylindrical shell. One fluid is provided in the shell and contacts the outer surface of the inner tubes. Another fluid is contained inside of the tubes. Heat exchange occurs in the shell at the outer surface of the tubes. Often times aluminum fins are provided on the copper pipes. These fins provide more surface area for heat exchange to occur.
(2) Tube in Tube: A tube is constructed in a tube, sealed separately to keep the fluids in one tube from contaminating the other. Heat exchange is conducted at the outer surface of the inner tube and the inner surface of the outer tube.
(3) Brazed Plate: This type of heat exchanger consists of multiple thin plates separated by a small distance. Each plate either carries the hot or cold fluid. Heat exchange occurs between the surface areas of each plate.
As previously mentioned the evaporator acts as a heat exchanger with a cold side and a hot side. The cold side consists of a mixture of refrigerant gas and liquid. At this point, the partial liquid-gas refrigerant mixture moves through the evaporator, picking up heat from the hot side. But instead of heating the gas, the heat is used to boil the remaining liquid. It is important for the evaporator to boil all of the liquid, prior to the refrigerant entering the compressor in the following step. Once all the liquid has boiled, the liquid-gas mixture turns into a refrigerant gas (vapor), called a saturated vapor. Any additional heat will now increase the temperature of the refrigerant vapor, into a region called super heat. Any release in heat will cause some of the gas to condense back to a liquid.
It is important for the engineer to understand that the amount of cooling provided through the evaporation of the refrigerant liquid is much more than simply increasing the temperature of the refrigerant liquid. For example, R-134a takes 92.82 Btu of heat to change 1 lb of refrigerant from liquid to gas. While it takes 0.204 Btu of heat to increase 1 lb of refrigerant gas by 1°F.
Step 2 - Compressor
The vapor compression cycle is the primary cycle used in commercial refrigeration systems.
The vapor compression cycle starts at (Step 1) the evaporator, with cold, low-pressure, liquid refrigerant. It absorbs heat and evaporates to a low-pressure gas. Then the gas is (Step 2) Compressed to a high-pressure, high-temperature gas and (Step 3) condensed to a high pressure gas. Finally, the gas is condensed at the (Step 4) expansion device to a cold, low-pressure liquid refrigerant.
Step 2: Compressor: The next step is where the refrigerant gas is compressed by the compressor, which raises the temperature and pressure of the gas. The compressor is where the work takes place. The compressor is also the driving force that moves the refrigerant through the vapor compression cycle and prepares the refrigerant before it enters the condenser. It is important that the refrigerant gas is raised to a temperature that is above the temperature of the fluid in the condenser. This will allow heat to be transferred from the refrigerant to the condenser fluid. The compression of the refrigerant gas occurs isentropically, meaning that there is no change in entropy. Since the compressor is not completely efficient there will be an increase in enthalpy as the heat generated by the compressor is transferred to the refrigerant gas.
Entropy - a measure of the amount of disorder in a thermodynamic system.
Enthalpy - a measure of the total energy in a thermodynamic system (sensible and latent energy).
The engineer should be knowledgeable of the 5 different types of compressors and their advantages and disadvantages, in order to determine when they should be used. The five types of compressors are centrifugal, scroll, reciprocating, screw and rotary. A brief overview of the different types of compressors is shown below.
- Rotary: The rotary type compressor compresses refrigerant gas through positive displacement.
Positive displacement simply means that the pressure of the gas is increased by reducing the volume.
- Scroll: Similar to the rotary type compressor, the scroll compressor uses positive displacement to increase the pressure of the gas.
- Screw: Similar to the rotary type compressor, the scroll compressor uses positive displacement to increase the pressure of the gas. The screw compressor consists of two interlocking screws. The gas moves through the screw from the beginning thread to the end thread, increasing the pressure as it moves to the discharge side.
- Reciprocating: A reciprocating compressor compresses gas through positive displacement. A piston type movement compresses gas as it enters the cylinder.
- Centrifugal Centrifugal compressors are not like positive displacement compressors, these compressors rely on a rotating impeller to use its centrifugal force to move the gas to the outside diameter of the rotating impeller, which increases the velocity of the gas. The increased velocity is then translated into increased pressure.
Another distinction between compressors is made between hermetic, semi-hermetic and open drive compressors.
Hermetic is most often recognized when used in the phrase “hermetic seal”, which means airtight.
Hermetic: A hermetic compressor is airtight. The compressor and motor are located in a welded container,
so no refrigerant can escape. Since the motor is located in the same enclosure as the compressor, the compressor needs to account for the motor heat.
Open Drive: An open drive compressor indicates that the compressor and refrigerant are located in an
enclosure and out of the enclosure is a shaft connecting it to a motor. The motor is outside of the
enclosure and the heat is lost to the space and not to compressor.
Semi-Hermetic: A semi-hermetic is similar to a hermetic compressor, except the motor and compressor are
located in a mechanically sealed container, which can be opened without cutting into the enclosure unlike the hermetic compressor.
Step 3 - Condenser
Step 3: Condenser: The third step in the vapor compression cycle is the condenser. The condenser is the counterpart
of the evaporator. Similar to the evaporator, the condenser is simply a heat exchanger. Except in this case, heat is
exchanged from the warm refrigerant gas to the cold medium. The heat released by the warm refrigerant gas causes it to change phases.
The refrigerant gas condenses to refrigerant liquid.
There are two types of condensers, similar to the two types of evaporators. Figure 5 shows a sample water cooled condenser,
where cool condenser water at ~85 °F is used to remove heat from the refrigerant, causing it to increase in temperature to
approximately ~95 °F. Figure 6 shows the air cooled system, where heat is removed from the refrigerant by blowing outside
air over the coil. The location will determine the condenser water and outside air temperatures.

The methods of heat exchange are similar to that of the evaporator. Refer to the evaporator section for the different types of heat exchangers.
Step 4 - Expansion Device
Step 4: Expansion Device: The final step is the expansion device, which is the counterpart of the compressor.
The expansion device reduces the pressure of the liquid, which causes not only the pressure to decrease but also the temperature
to decrease. During this process, some of the liquid refrigerant is turned into a gas, this is called flash gas. The
resultant of the expansion device is a cold partial liquid-vapor refrigerant mix. The cold refrigerant liquid-vapor mix
then repeats the process at the evaporator.
The expansion device that is primarily used in air conditioning systems is called a thermostatic expansion valve (TXV.
The TXV as its name describes, opens and closes, based on a thermal device. The adjustment of the opening/closing determines
the amount of refrigerant that is passed through and evaporated. The TXV uses the temperature of the evaporator output
as a basis for determining the amount of refrigerant.
For example, if the TXV senses that the evaporator is producing an output refrigerant temperature that is too cold, then
there is too much refrigerant for the heat load (hot side of the evaporator) and the refrigerant sent to the evaporator
needs to be throttled down (decrease cold side of the evaporator). If the TXV senses that the output of the evaporator is
too high, then the amount of refrigerant cannot keep up with the heat load (hot side) then the TXV should allow more
refrigerant to the evaporator (increase cold side).
Pressure Enthalpy Diagram
On the P-H diagram, pressure is indicated on the y-axis and enthalpy is indicated on the x-axis. Typically enthalpy is in units of Btu/lb and pressure is in units of pounds per square inch (psi). The upside down U figure shown on the diagram designates the points at which the refrigerant changes phase. The left vertical curve indicates the saturated liquid curve and the right vertical curve indicates the saturated vapor curve. The region in between the two curves describe refrigerant states that contain a mixture of both liquid and vapor. The locations to the left of the saturated liquid curve indicate that the refrigerant is in liquid form and locations to the right of the saturated vapor curve indicate that the refrigerant is in vapor form. The point at which the two curves meet is called the critical point. The importance of this point is that at any point above, no additional pressure will change the vapor into a liquid. A simplified pressure-enthalpy diagram is shown below, describing this information.

The curves break up the diagram into three regions (1) Liquid, (2) Vapor and (3) Mix.
(1) Liquid Region: The liquid region is also known as the sub-cooled region. In this region there are vertical temperature lines, which increase as enthalpy is increased. Figure 8 is a simplified P-H diagram illustrating the constant temperature lines.
(2) Vapor Region: The vapor region is also known as the super heated region. In this region there are vertical temperature lines, which increase as enthalpy is increased. Refer to Figure 8. There are also lines of constant entropy, which are also important. Entropy is the measure of the amount of disorder in the system.
(3) Liquid-Vapor Mix Region: In this region, the P-H diagram shows horizontal temperature lines, which indicate constant temperature. The mix region is the phase change region, where any addition of enthalpy will cause additional liquid to vaporize instead of raising the temperature. Figure 8 illustrates the horizontal temperature lines in the mix region. There are also upward sloping curves which indicate quality. Quality is a measure of the ratio of vapor mass to total mass. For example quality of 0.1 or 10%, which is located near the saturated liquid line, describes points that have 10% vapor by mass. The 0.9 or 90% line, which is located near the saturated vapor line, describes points that have 90% vapor by mass. The previous figure, Figure 7, indicates the quality lines.

The x-y axes of the P-H diagram are the pressure lines running from left to right. The enthalpy lines are the vertical lines. The skeletal graph shown below shows the pressure-enthalpy lines.

Refrigeration Cycle
One of the most important skills needed for the professional engineer in the HVAC and Refrigeration field is navigating the refrigeration cycle on a pressure-enthalpy diagram. The following sections will show each specific part of the refrigeration cycle on the pressure-enthalpy diagram and it will also highlight the important points and calculations needed.
Throughout this explanation the refrigerant R-134a is used as an example. It is recommended that the engineer get a copy of the P-H diagram for R-134a and the other common refrigerants. These diagrams can be found in the ASHRAE Fundamentals book. A sample R-134a diagram is shown below, with a sample refrigeration cycle, identifying (Step 1) Evaporator, (Step 2) Compressor, (Step 3) Condenser and (Step 4) Expansion Device.

STEP 1: EVAPORATOR
The refrigerant entering the evaporator is a cold, partial liquid-vapor mixture. The operating pressure and temperature of the evaporator is called the suction pressure and suction temperature. The suction line is the piping that routes refrigerant gas from the evaporator to the compressor. It is important to note that in the mix region, the pressure and temperature are dependent variables.
For example, if a compressor operates at a suction pressure of 36.8 psia, then the corresponding evaporator pressure is 36.8 psia and the corresponding evaporator temperature is 25 °F, see below figure for points A and B (Values are for Refrigerant R-134a). If the compressor operates at a suction pressure of 49.7 psia, then the corresponding evaporator pressure is also 49.7 psia and the evaporator temperature is 40 °F. See below figure for points A' and B'(Values are for Refrigerant R-134a).

The evaporator moves the refrigerant from point A (partial liquid-vapor mixture) to point B, a fully saturated vapor refrigerant. As the evaporator transfers heat to the refrigerant, there is no gain in temperature, since all the heat is used to convert the remaining liquid to a gas. In an ideal evaporator, there is just enough heat transfer to convert all the liquid to gas and nothing more. Thus, the output of an ideal evaporator is 100% vapor at the same entering temperature, refer to figure below. In this figure, we see that as the refrigerant moves through the evaporator, the temperature remains the same and the percentage of vapor increases, until it reaches saturation at 100%.

Also introduced in the figure above is the term superheat. If additional heat were to be added to the 100% vapor refrigerant, then the heat would be used to increase the temperature and it is this increase in temperature that is called superheat.
In the figure below, an evaporator with 15 °F superheat is shown. The refrigerant reaches 100% vapor prior to leaving the evaporator. All the additional heat from this point is used to increase the temperature of the refrigerant until it reaches a temperature of 40 °F. This refrigerant has a superheat of 15 °F because the final temperature is 15 degrees passed the saturation temperature of 25 °F. It is important to note that the pressure remains constant throughout the evaporator.

On the pressure-enthalpy diagram superheat is shown as horizontal movement along the suction pressure line passed the 100% vapor curve. The figure on the following page shows the difference between 0 °F and 15 °F superheat. Point B is the 100% vapor point at a constant evaporator/suction pressure of 36.8 psia and a temperature of 25 °F. Point B' results from additional heat/enthalpy added to the refrigerant. The refrigerant moves from point B to point B', where the resulting temperature is 40 °F.

STEP 2: COMPRESSOR
The compressor is characterized by the refrigerant suction and discharge conditions. Horizontal lines are drawn across the refrigerant's pressure enthalpy diagram for the suction and discharge pressures. Then the incoming temperature of the compressor, as determined by the leaving temperature of the evaporator, is used as the starting point of the compressor, as shown by point B' on the figure below. The compressor then increases the pressure of the refrigerant up to the discharge pressure. Compression occurs at constant entropy, also known as isentropic compression. Therefore the intersection of the constant entropy line and the discharge pressure line will identify the final condition of the refrigerant gas leaving the compressor, as shown by point C' in the figure below.

A common skill, that is required of a professional engineer, is to determine the work done by the compressor. This work is shown in the figure above as the difference between the compressor entering enthalpy (H1) and the leaving enthalpy (H2). The equation to determine the work of the compressor is shown below. This equation multiples the refrigeration flow rate by the change in enthalpy between the discharge and suction conditions.
The x-y axes of the P-H diagram are the pressure lines running from left to right. The enthalpy lines are the vertical lines. The skeletal graph shown below shows the pressure-enthalpy lines.

STEP 3: CONDENSER
The refrigerant entering the condenser is now a hot, high pressure refrigerant gas. The condenser is shown on the pressure-enthalpy diagram as a horizontal line. This horizontal line is a line of constant pressure, corresponding to the discharge pressure of the compressor. The condenser proceeds from right to left in the following three steps:
(1) The superheated gas cools down to saturation temperature [C' 160 °F to D' 140 °F]. Cooling takes place as heat flows from the hot refrigerant gas to the condenser cooling medium.
(2) Next, the 100% saturated vapor at D' is converted to 100% saturated liquid at D''. Heat is lost to the condenser cooling medium as the vapor is condensed to a liquid.
(3) Finally, the 100% saturated liquid is sub-cooled from D'' to D'''[140 °F to 115 °F]. In an ideal condenser, no sub-cooling occurs. Once the refrigerant is a fully saturated liquid, any additional heat loss results in a decrease in temperature. This cooling of the saturated liquid is referred to as sub-cooling. In this example, the refrigerant has gone through 25 °F of sub-cooling and resulted in a sub-cooled temperature of 115 °F.

A common question is to determine the heat expelled by the condenser, which is shown in the figure above as the difference between the condenser entering condition (H2) and the leaving condition (H4). The equation to determine the net condenser effect is shown below. This equation multiples the refrigeration flow rate by the change in enthalpy between the entrance and exit of the condenser.
The x-y axes of the P-H diagram are the pressure lines running from left to right. The enthalpy lines are the vertical lines. The skeletal graph shown below shows the pressure-enthalpy lines.

STEP 4: EXPANSION DEVICE
The expansion device is the counterpart of the compressor. Similarly, the expansion device is characterized by the suction and discharge pressures. Horizontal lines are again drawn on the refrigerant's pressure-enthalpy diagram. The input condition of the expansion device is determined by the condenser output conditions.
There are two entering conditions to the expansion device shown on the following diagram. The first situation has 0 °F of sub-cooling [D’’] and the second situation has 15 °F of sub-cooling [D’’’].
The expansion device expands the high pressure refrigerant gas adiabatically to a low pressure liquid-vapor refrigerant mixture. Adiabatic expansion indicates that there is no change in enthalpy and is characterized by a downward vertical line as shown on the below graph.
Note on the graph below as the refrigerant moves from point D to point A, the refrigerant moves from the liquid phase of the graph to the vapor-liquid mixture region. The amount of gas that is formed during this expansion is called flash gas.

Steam P-H Diagram
The pressure enthalpy diagram for steam is an excellent tool to gain an understanding of the steam tables. The pressure-enthalpy diagram describes the liquid, vapor and mix region of water. As shown in the following figure, the P-H diagram consists of Pressure (PSIA) on the y-axis and Enthalpy (Btu/lbm) on the x-axis. It is important to note that pressure is shown on a logarithmic scale while enthalpy is shown in a normal scale. In the middle of the diagram is the vapor dome. This dome separates the sub-cooled liquid (aka water) on the left side, super-heated vapor (aka steam) on the right side and the liquid-vapor mix region (aka mixed region or wet region) in the middle.

The mixed region is cut by upward sloping lines that represent the percentage of vapor, as shown in the following figure. The figure shows that as you move from left to right on a constant pressure line, the percentage of vapor increases from 0% at the saturated liquid to 100% at the saturated vapor line. The percentage of vapor is also known in other terms as steam quality and dryness fraction, where saturated vapor has a steam quality or dryness fraction of 1.

The P-H diagram is also helpful in illustrating the relationship between the enthalpy of the saturated liquid, saturated vapor and the enthalpy of vaporization.
As shown on the following figure, on the left the enthalpy of saturated liquid is found and as enthalpy is added to the saturated liquid, moving from left to right at constant pressure, the enthalpy of saturated gas (steam) is found at the saturated vapor line. The difference between the two enthalpies is the latent heat (enthalpy) of vaporization.

If a point in the mix region is selected, then the relationship between the enthalpy of the mixed steam and the enthalpy of saturated liquid, enthalpy of vaporization and steam quality is as shown below.

In the figure above, the point is shown on the 50% steam quality, therefore only 50% of the enthalpy of vaporization has been added to the enthalpy of saturated liquid.

The next important part of the P-H diagram is the constant temperature lines. These lines are characterized by nearly vertical lines in the sub-cooled liquid and super-heated steam region. This means that any increase in enthalpy during these phases, causes the temperature of the liquid or steam to increase and vice versa for decreases in enthalpy. in the mixed region, temperatures are shown to remain constant with increasing enthalpy and are identified as horizontal lines. As enthalpy is added to a saturated liquid, the temperature does not change, because the enthalpy is going towards the enthalpy of vaporization and is changing the phase of the liquid to a vapor.

A common point on the P-H diagram that the engineer should memorize is the location of the boiling point of water at 1 atmosphere (14.7 PSIA) which is 212 F. It is important to note that if the temperature of a saturated liquid/vapor of mixture is known then the pressure can be determined. This is because in the phase change region, pressure and temperature are dependent on each other. However, in the mixed region, the engineer is unable to determine the location on the P-H diagram with only temperature and pressure. Another value must also be known, like entropy, specific volume or steam quality. For example, if the engineer was asked to determine the enthalpy of water at 212 F, 14.7 PSIA, it would be impossible, because the point could be located anywhere in between the saturated vapor and liquid lines, along the constant pressure/temperature lines in the dome.
Entropy lines on the P-H diagram are shown as downward sloping curves, refer to the figure below.

Entropy increases as enthalpy is increased in all three regions. Entropy is shown to decrease in the super heated steam region when pressure is increased. Constant entropy lines are used during an isentropic process, which means a conversion in which entropy is held constant. One common process is the flow of steam through an ideal steam turbine. Steam enters the turbine at a high pressure and leaves at a lower pressure, transmitting the thermal energy to mechanical work.
The final set of lines on the P-H diagram is the constant specific volume lines, shown below. Specific volume lines are nearly horizontal in the vapor region and nearly vertical in the liquid region. It can be seen that in the liquid region, there is very little change in specific volume. However, in the superheated vapor region, there is a wide range of specific volume. Specific volume is shown to increase as pressure is lowered.

Although the P-H diagram is a very powerful tool, typically steam tables are used to solve steam problems. Steam tables are simply a listing of the values of specific volume, enthalpy and entropy as a function of pressure and temperature at the saturated liquid and vapor curves.
Steam Tables
There are three main types of steam tables that the engineer must be able to use the, (1) Saturation Tables as a function of pressure; (2) Saturation Tables as a function of temperature and (3) Superheated Steam Tables. Graphically the steam tables show the values of the outer dome on the pressure-enthalpy diagram. The following figure shows the points that are selected for the steam tables. This figure shows the values as a function of pressure.

The following figure shows the points that are selected for the steam tables. This figure shows the values as a function of temperature.

There are also steam tables for steam in the super-heated region. These steam tables are shown as a function of pressure and temperature. These values are selected because they are the easiest to measure in practice.

The steam tables show that as temperature increases the specific volume, the enthalpy and the entropy increase. As pressure increases there is a decrease in specific volume, enthalpy and entropy.
Mollier Diagram
The Mollier diagram also known as the enthalpy-entropy diagram shows graphically the various properties of steam ranging from superheated steam to the mixed region. The diagram does not provide water (liquid) properties. A sample of the diagram is shown below in order to illustrate the main points of the diagram and how to use the diagram. The aspiring professional engineer should refer to the actual tables located in the ASHRAE Fundamentals or the Mechanical Engineering Reference Manual.

First, inspect the axes, note that the y-axis indicates enthalpy and the x-axis indicates entropy. The Mollier diagram shows only two regions, the mixed region of vapor and liquid and the super-heated vapor steam region. The two regions are separated by the downward sloping saturation line, where steam quality is equal to 1. Secondly, notice the upward sloping (left to right) constant pressure lines. Constant dryness fraction or steam quality lines are shown as downward sloping in the mix region. Finally, the diagram has slightly downward sloping constant temperature lines, which is only applicable in the super heat region.
Determining Properties of Steam
One of the main skills that the aspiring professional engineer must acquire is the ability to determine the properties of steam. In practice, the pressure and temperature of steam can be found easily. The other useful properties of steam like entropy, enthalpy and specific volume must be found through the use of the (1) P-H Diagram, (2) Mollier Diagram and (3) Steam Tables.
A simple way to find the properties of steam given the temperature and pressure is to draw a simple P-H diagram. For example, assume water is at 14.7 psia and 60 F, we can draw a simple P-H diagram. It is known that at 14.7 PSIA (1 ATM), the boiling point is 212 F, thus the constant temperature line in blue can be drawn. Since the temperature of the water is 60 F, then the point must be located to the left along the horizontal constant pressure line. Note that since constant temperature lines are vertical in the sub-cooled liquid region, that the enthalpy of water at 14.7 PSIA, 60 F is equal to the enthalpy of saturated liquid water at 60 F (take vertical line down from 14.7 PSIA, 60 F to the intersection of the saturated liquid curve.

If water was given at a temperature of 212 F and a pressure of 14.7 PSIA, then it would be impossible to find the location. The point could be located anywhere at the intersection of the constant temperature line in blue and the horizontal constant pressure line, which is anywhere on and in between the saturated liquid and vapor curves.
The previous example is simple because it is near the standard boiling point. However, the same method can be used for varying temperatures and pressures. For example, water at 600 F and 300 PSIA. Start the sketch by drawing in the constant temperature line for 600 F. Then look up the steam tables as a function of temperature and find 600 F. In the table it shows that saturated steam at 600 F corresponds to a pressure of 1542.5 PSIA. It is also known that the point must lie on the constant temperature line and it must lie below the horizontal portion corresponding to a pressure of 1542.5 because the pressure is only 300 PSIA.

Steam Boilers
Steam boilers are mechanical pieces of equipment designed to convert water in liquid form to steam through the combustion of a fuel source like natural gas. There are many different types of boilers but most are characterized by pressure and heat exchanger type.
Low pressure boilers operate below 15 PSI, high pressure boilers operate above 150 PSI and medium pressure boilers operate in between 15 and 150 PSI. The different types of heat exchangers describe the location of the fuel and the water. Water tube boilers have water in tubes, with the hot combustion gases around the tubes, while fire tube boilers have combustion gases flowing through tubes that are submerged in water.
It is important for the engineer to understand the three different systems that comprise a boiler system, the (1) Feed-water System, (2) Combustion System and (3) Steam System.
(1) The feed-water system describes the incoming fluid water to the boiler. It consists of a feed-water pump, water softeners to remove minerals that can damage boilers and de-aerators to remove oxygen. Feed-water is provided by a mixture of the water supply and condensate return. The important part of the feed water system is to be able to determine the entering enthalpy of the feed water, depending on the pressure and temperature of the incoming water. As previously discussed, water in the sub-cooled region has enthalpy values that are a function of temperature.
(2) The combustion system describes the fuel portion of the boiler. The combustion system consists of oxygen supply, typically provided by a fan or air is naturally induced, an ignition and the fuel supply and piping. It is important to be able to determine the total heat supplied by the fuel. Total heat is shown as Q, which is a function of the mass flow rate of the fuel, the higher heating value (HHV) of the fuel and the boiler efficiency. The HHV can be found in the Mechanical Engineering Reference Manual. Boiler efficiencies are a function of the losses in the system, like

(3) The steam system is the output portion of the boiler. It consists of the outgoing steam piping to the steam consuming pieces of equipment, which in the HVAC and Refrigeration field are steam heating coils for air distribution and for water distribution. The output of the boiler is either saturated steam or a super-heated steam and the values for this steam output can be determined from the saturated steam tables or the super-heated steam tables.
Efficiency of a boiler is found by dividing the output energy by the input energy. The output is found by determining the change in enthalpy between the feed-water and the super-heated steam. The input is determined by the mass flow rate of the fuel and the higher heating value of the fuel.

This efficiency often referred to as the fuel-to-steam efficiency and is a true measure of the boiler input to output efficiency. There are other efficiencies that are out of the realm of this book, like the thermal efficiency and combustion efficiency. These items are more representative of the Thermal and Fluids topic and this page focuses more on the HVAC and Refrigeration topic.
Steam Heating Coils
Steam heating coils are in its simplest form, heat exchangers. The steam transfers its latent heat to either air or water. On one side of heat transfer (energy balance) equation is the condensing rate of the steam. On the other side of the equation is the energy transferred to either the air or water.


Key Steam Equations


