- HOME
- FE EXAM
- PE EXAM
- DESIGN TOOLS
- COURSES
- STORE
- ABOUT
- CONSULTING
![]()
Engineering Pro Guides is your guide to passing the Mechanical & Electrical PE and FE Exams
Engineering Pro Guides provides mechanical and electrical PE and FE exam technical study guides, practice exams and much more. Contact Justin for more information.
Email: contact@engproguides.com
EXAM TOOLS
Basic Engineering Practice
for the Machine Design & Materials P.E. Exam
by Justin Kauwale, P.E.
Introduction
Basic Engineering Practice accounts for approximately 9 questions on the Machine Design & Materials Mechanical PE exam.
The Machine Design & Materials Mechanical PE exam is designed to ensure that a passing engineer is minimally competent to practice engineering. Being minimally competent does include understanding engineering terms, symbols and technical drawings, unit conversions and economic analysis. However, many of these tasks can be completed without an engineering background and thus the PE exam should provide questions that are more complex than just questions in one of these topics. You may have to decipher a technical drawing and use the information to complete a machine design question or you will complete strength of materials questions and need to convert units to match the selected answers.
This section provides brief guidance on easier topics like engineering terms, symbols, technical drawings, units & conversions and also provides more detailed teaching on QA/QC skills in Machine Design and Economic Analysis. The topic of design methodology does not include skills or concepts that are easily testable on the PE, except for the critical path method.
There are nine questions and six sub-topics. This means that it is possible for there to be one or two questions on a sub-topic. Please remember these numbers and try not to get too bogged down on a single sub-topic, since the odds of several questions on a single sub-topic is low.
The information shown on this website is a sample of the material provided in the technical study guide and sample exam. See the STORE to purchase these items.
Engineering Terms & Symbols
This NCEES topic is very vague and provides little information for the aspiring professional engineer. Engineers become more familiar with terms, symbols and technical drawings with experience and as they encounter new things. It is the opinion of the author that a test on your knowledge of random terms or symbols, other than those presented in the other topics of the syllabus is not fair nor is it an adequate measure of a minimally competent professional engineer. The Machine Design & Materials field is a large field and it would not be prudent use of your time to memorize terms and symbols. However, you should be familiar with the terms and symbols presented in this book, since they are relevant to the remaining exam topics.
References
The best references for learning other engineering terms and symbols that are not presented in this book are the collection of ASME Y14 standards. ASME stands for American Society of Mechanical Engineers. This is the main ASME standard that would be used on the Machine Design exam. You should not need to purchase these standards. These standards are only shown below to provide you more information.
ASME Y14.2: Line Conventions and Lettering
This standard provides a table that shows the different types of lines shown on engineering drawings. Please see below for the various types of lines and how/when these lines are used. It is not necessary to purchase this book for the exam.
ASME Y14.3: Orthographic and Pictorial Views
This standard provides examples for the various types of views that can be used to represent an object. These views include one-view, two-view, three-view, partial views and details. Also included in this book are examples of sectional views like full sections, half sections, revolved, broken-out and removed sections. It is not necessary to purchase this book for the exam.
ASME Y14.5: Dimensioning and Tolerancing
This standard establishes uniform practices for stating and interpreting dimensioning, tolerancing, and related requirements for use on engineering drawings and in related documents. This reference will help you to solve problems in the Basic Engineering Practice section and the Fits and Tolerances type problems in the Supportive Knowledge section. This book is difficult to read when you are pressed for time. It is recommended that you use the skills presented in this study guide to solve these types of problems, but if you want more background information then you can purchase the ASME Y14.5 standard.
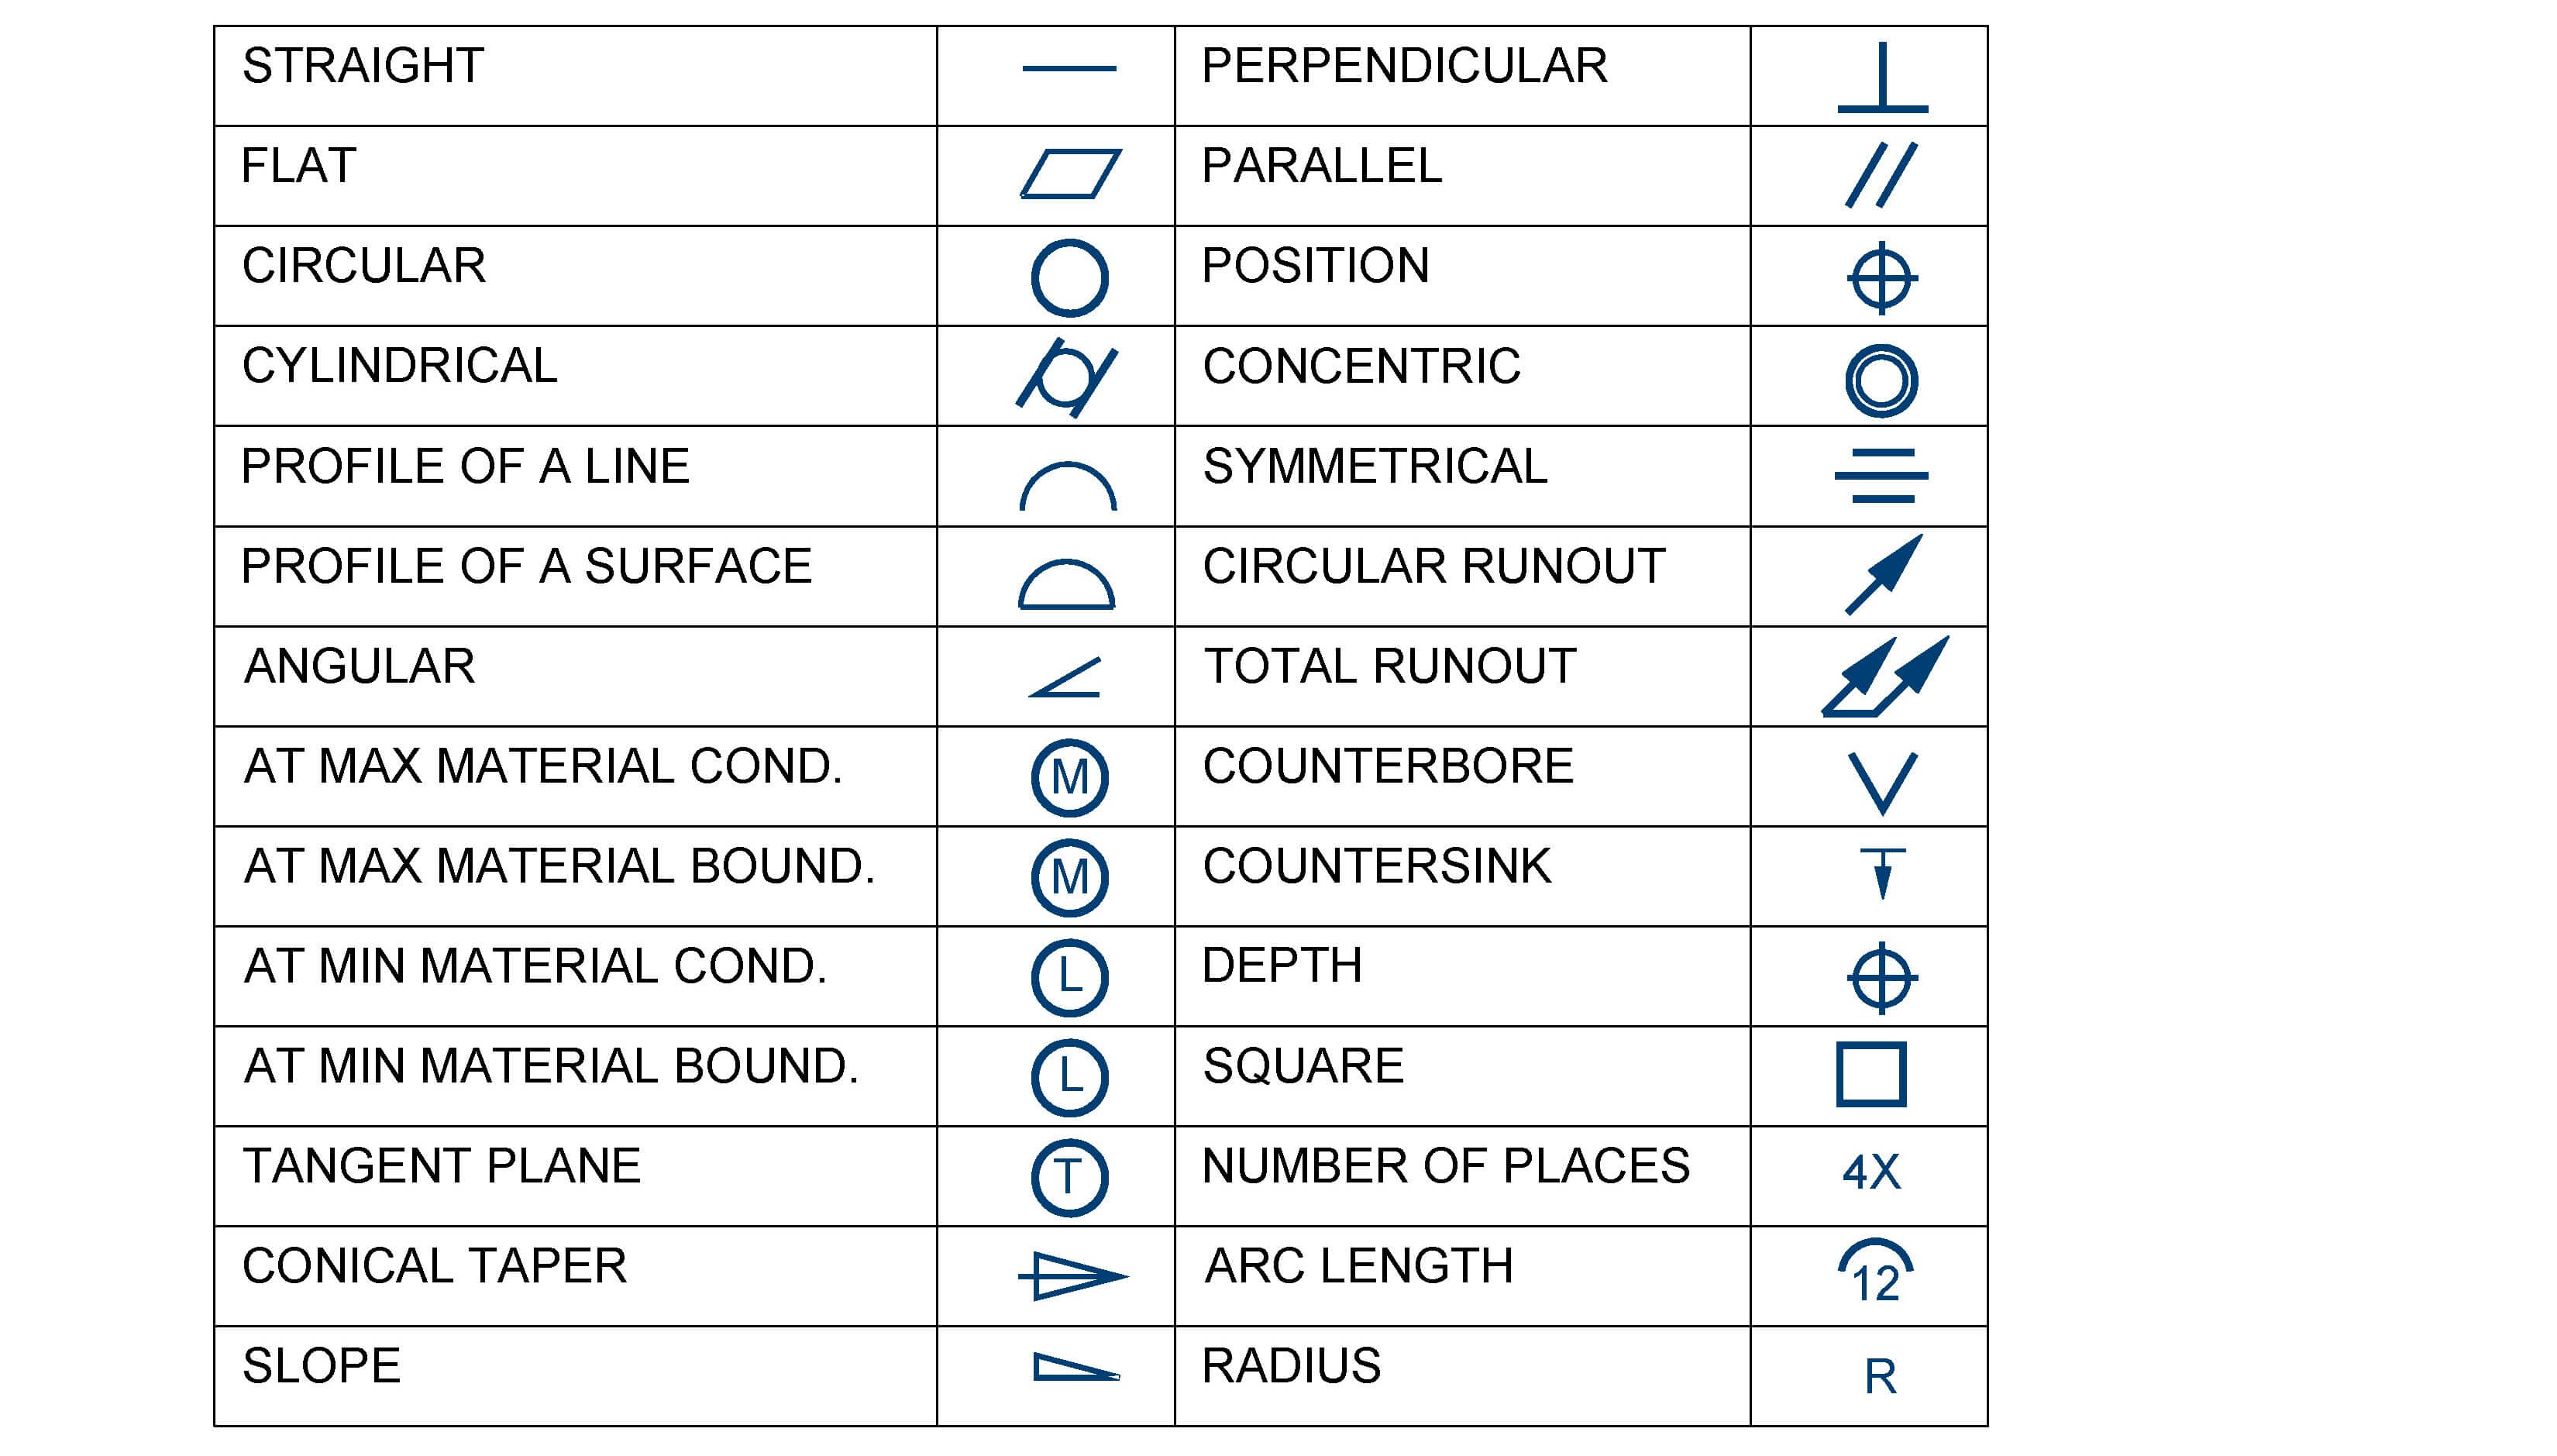
Figure 1: This table shows sample of the symbols used in Machine Design.
Welding Terms and Symbols
The exam will reference welding terms and symbols based on the standard that is most commonly practiced. The primary welding standard is the American Welding Society (AWS) A2.4:2012 Standard Symbols for Welding, Brazing and Nondestructive Examination. This standard includes information on welding symbols, as well as all the various types of welds like groove, fillet, plug, spot, seam, edge, stud and surface welds. The standard also includes information on brazing symbols and nondestructive examination symbols. However, these topics are not likely to be on the PE exam. The link to purchase this book is shown below, but it is expensive and you should only buy this book if you regularly design or interpret designs with welding.
A2.4:2012 STANDARD SYMBOLS FOR WELDING, BRAZING, AND NONDESTRUCTIVE EXAMINATION:
Link: https://pubs.aws.org/p/1040/a242012-standard-symbols-for-welding-brazing-and-nondestructive-examination
The main concepts you need for the exam on this topic are covered below. First you need to be familiar with the different types of welds and the symbols for each weld. This table provides the symbols for the various types of welds.
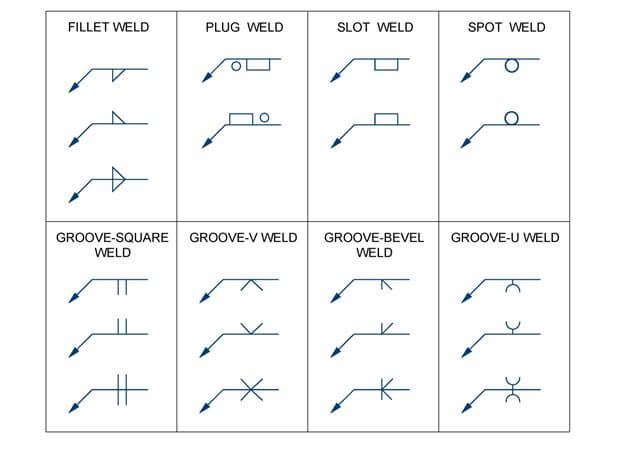
Figure 2: Symbols for the different types of welds.
- Fillet Weld: Fillet welds join two parts at right angles to each other. The thickness of the weld can be varied.
- Plug Weld: Plug, slot and spot welds are welds used to join two surfaces one atop the other. This is called a lap joint. But unlike a fillet weld, these two surfaces are parallel to one another. A plug weld is a circular weld made through the top surface and joins the bottom surface.
- Slot Weld: In a slot weld, a slot shape is made through the top surface and welding fills the slot to join the top surface to the bottom surface. Spot Weld: A spot weld is made through the top surface to the bottom surface. The top surface is not cut.
- Groove-Square Weld: Groove welds are used to join the ends of two parts together. The surfaces of the two parts are butted against each other in parallel. The empty space between the two surfaces is filled with the weld. The shape of this empty space in a groove-square weld is in a rectangular/square shape.
- Groove-V Weld: In a V-weld, the empty space is in a shape of a V. The weld fills up this V empty space.
- Groove-Bevel Weld: A bevel is the shape of a one-half of a V.
- Groove-U Weld: A U weld is the shape of a U.
Welding is covered in more detail in Section 8.0 Joints & Fasteners. This website also has more information on welding, including 3-dimensional pictures showing all sorts of welds.
Weld Joints and Weld Types
Link:
https://www.g-w.com/pdf/sampchap/9781590708668_ch06.pdf
The next concept that you must understand when reading welding symbols is how the symbol portrays the location of the weld. The symbol type location relative to the leader determines what side the weld must be completed. If the symbol is below the leader, then the weld occurs on the side of the arrow. If the symbol is above the leader, then the weld occurs on the other side of the arrow. You should be familiar with these terms, “arrow side” and “other side”. The figure below shows you graphically how the symbols determine the location of the weld. If the welding symbol is above and below the leader, then the weld occurs on both sides.
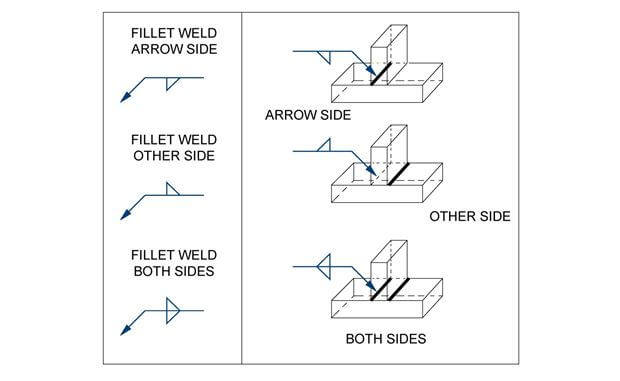
Figure 3: This figure shows the weld location in isometric view, based on the welding symbol.
Next, welding symbols can be added upon another with the following add-on symbols. For example, fillet welds can be added to a groove-bevel weld as shown in the next figure.
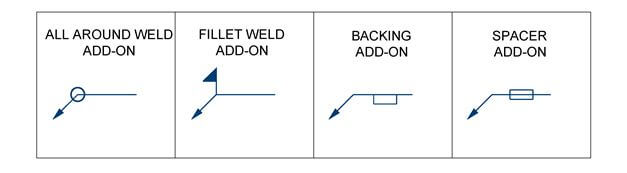
Figure 4: These symbols for add-ons can be included on top another weld.
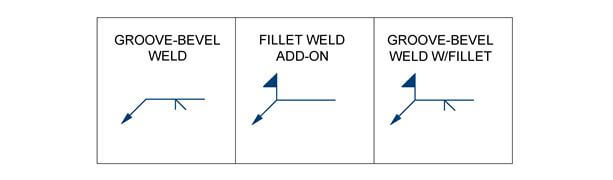
Figure 5: Welding symbols can be added one upon another. In this example you start with the groove-bevel weld on the left and then you add the filet weld add-on. This results in the final figure on the right.
Finally, welds are assigned sizes, thicknesses, lengths, angles and finishes as shown in the following figure and descriptions.

Figure 6: This diagram will help you to understand welding symbols. Use this figure and the following descriptions of each letter.
- T: This is the tail of the symbol and may or may not be included. The tail can be used as a reference or to indicate a specific process that is required.
- S: This term refers to the size or strength of the welds, for example this could be the depth of a bevel weld.
- E: This is the size of the groove weld.
- L: Length of weld.
- P: Pitch of the weld.
- N: This letter will indicate the number of a certain type of weld like spot or seam.
- F: Finishing designation
- A: Angle of groove weld or angle of countersink for plug welds.
- R: Depth of filling for slot or plug welds. {Other} and {Arrow}: This is the location for the symbol that describes the type of weld, like bevel, groove, plug, etc. These different types of weld symbols were previously discussed.
Interpretation of Technical Drawings
Technical drawings are a tool used by engineers to present ideas to others. An engineer should be able to produce technical drawings to accurately communicate design intent. At the same time, the engineer should be able to read and interpret these technical drawings. Engineering drawings are unique from typical sketches or illustrations, because engineering drawings show data like sizes, shapes, angles, tolerances, and dimensions. On the exam, you may be tested on your interpretation of these engineering technical drawings.
There are four main types of drawings that each focus on a different point of view.
- Plan/Layout: This is the top view or bird’s eye view. If the object is flipped, then the view would be a bottom view.
- Elevation: The elevation view is a side view. The elevation view is the vertical perspective from the face of an object.
- Section: The section view is also a side view, but there is a distinction between a section view and elevation view. The section view is a cut into the object and shows a look at the insides of the object, as if the object was cut. An elevation view is from the outside of the object.
- Isometric: The isometric view is a 3D view of an object.
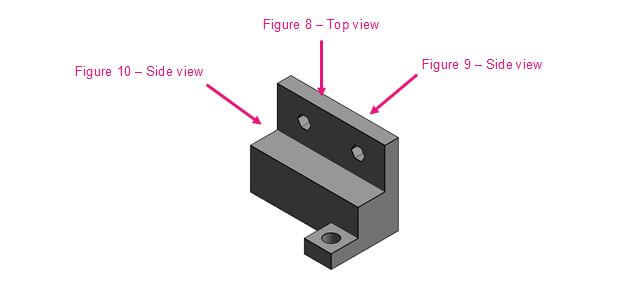
Figure 7: A 3D view, also known as an isometric view of a mechanical object.
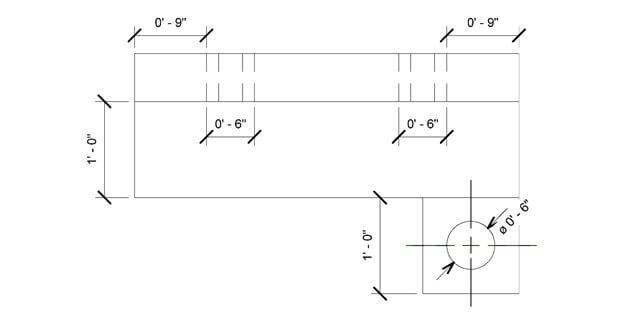
Figure 8: A top view or layout view of the same object, with dimension lines.
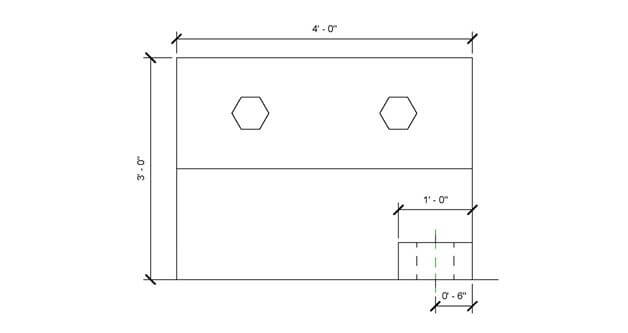
Figure 9: A side view or elevation view of the same object, with dimension lines.
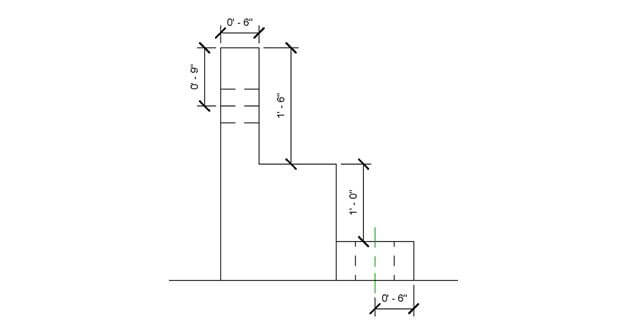
Figure 10: A side view or elevation view of the same object, with dimension lines.
In the last section of this book, tolerances and fits will be discussed further, but these terms will be introduced here in this section. Tolerances are used to describe the total amount that a dimension of a product may vary. It is defined as the difference between the maximum and minimum dimensional limits. When manufacturing products, there will be variations in the final products and there needs to be an appropriate tolerance allowed for each characteristic dimension.
A common problem that can be given on the PE, that tests your understanding of tolerances and fits, is when a part must fit into another part. This will be discussed in Section 9.0 Supportive Knowledge section. For the problems that require you to interpret technical drawings on the PE exam, you should have a good understanding of the terms and symbols that were presented earlier. You should also be able to follow drawings from all views, like plan, isometric, elevation and section.
Quality Assurance and Quality Control
In Machine Design, quality assurance and quality control are very important. This topic is generally broad, but in machine design it is focused on the conformity of products. In order to produce quality control in the most efficient manner, quality control charts and techniques were created. Since it would be very inefficient to individually inspect and measure each part and product for perfect quality, the following statistical approaches are used. Calculations for these statistical approaches are time consuming and typically require complex calculators or software. However there are some aspects of quality control that can be tested on the PE exam.
If you would like more information on quality control, you can read the following resources. The first is a free .gov website and the other is a paid book. For the purposes of the exam, you should only need what is presented in this book. If you need to increase your confidence on QA/QC, then you should read the additional information from the .gov website.
Link: Engineering Statistics Handbook
Link: Fundamentals of Quality Control and Improvement
Control Charts
On the PE exam you may be presented with a control chart or a table. Both forms are used to present the level of quality in a production batch. The control chart will measure a certain aspect of the product that needs to be quality controlled. For example, a bolt’s diameter must be measured in order for it to fit within a specific application. Once the bolt diameter is measured within a set of tolerances, it can be labeled as a certain size. The allowable tolerance values are represented by the upper and lower control limits in the equations below.
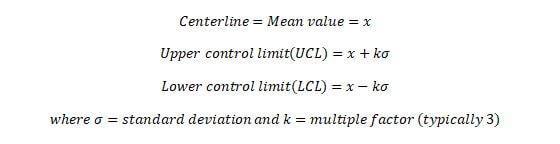
An example will be shown to walk you through the calculations for mean value and the UCL/LCL values.
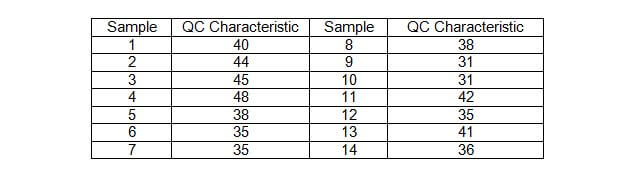
In the above chart, the QC characteristic is a measurement for a specific sample. The mean or average value of the samples is found by adding up all the QC Characteristic values and dividing by the total number of samples which is 14. In this example, the mean or average value is 38.5. The standard deviation is found by adding up the square of the differences between each QC characteristic value and the mean value, then dividing this number by the number of samples. Finally take the square root to find the standard deviation.

The mean and standard deviation can then be used to find the UCL and the LCL. For this example, assume k = 3.

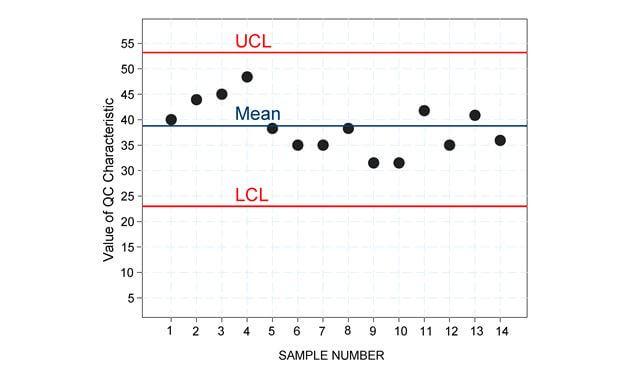
Figure 11: This figure shows the mean and UCL/LCL lines for the table of samples previously shown.
Control Charts with Sample Sizes
The previous section gave you the basics of control charts and introduced terms like mean, UCL and LCL. This section builds upon the basics and introduces the term sample sizes. Sometimes samples are taken in sets/groups of 3 to 10 samples per set or sometimes more. When you take a group of samples, there are two values that you can measure for each group. The first is the mean of that group of samples, the second is the range.
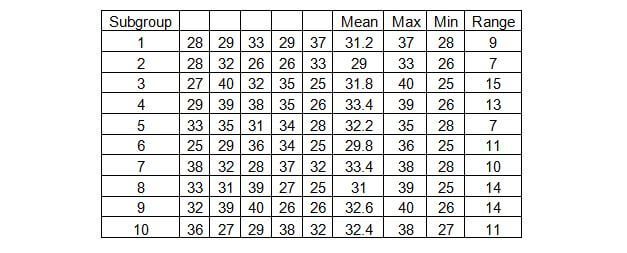
The range is simply the difference between the largest and smallest value within the subgroup.

There are three types of charts that are created to monitor quality control. These charts are the R Chart, X bar Chart and the s-Chart. The R-chart is a plot of the ranges of the subgroups. The X bar chart is a plot of the averages of the subgroups and the s-chart is the plot of the sample’s standard deviations. Luckily the s-chart is much more complex and its equations are more involved, which indicates that the s-chart will most likely not be on the PE exam. Therefore, you should focus on the other two charts. In order to understand these charts you must also understand the following table, which shows the factors for computing the control limits and centerlines for these charts, based on the number of samples. The following guide introduces how the constants on the next table apply to the various charts.
Control Chart Factors
A2: This control chart factor is used to find the UCL and LCL of the averages as a function of the grand mean and the average range.

D4 and D3: These control chart factors are used to find the UCL and LCL of the average range.

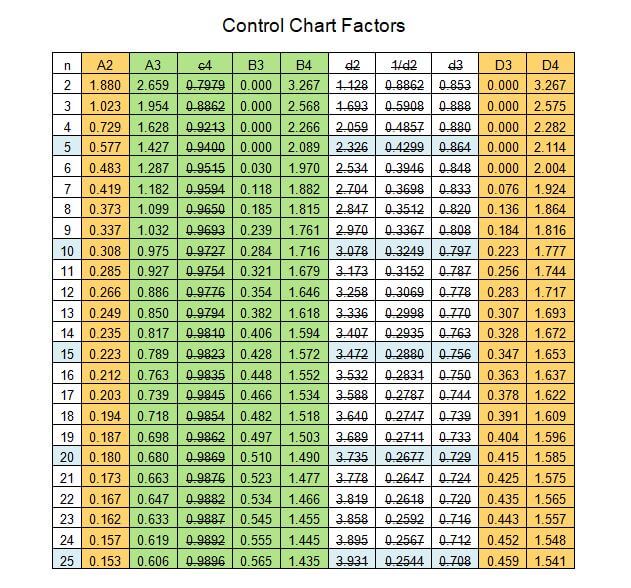
d2 and 1/d2: These two terms are crossed out because these values are only used to determine A2.

d3: This term is crossed out because it is only used to determine D3 and D4.

B3, B4: These terms are used in s-charts to find UCL and LCL.

A3: This term is used to find the UCL and LCL of the grand mean through the use of the average standard deviation.

c4: This term is crossed out because it is used primarily to find A3, through the following equation.

R Chart
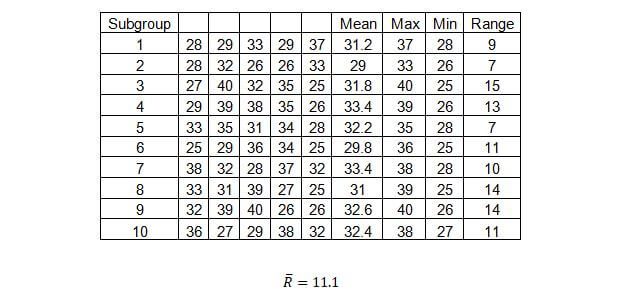
The R-chart plots the ranges for the various subgroups and the average (mean) of the ranges for all the subgroups. The average of the example is 11.1.
Next, in order to find the UCL and LCL, you must use the following equations.

You should notice that the sample size is 5, thus the corresponding factors are as shown below:

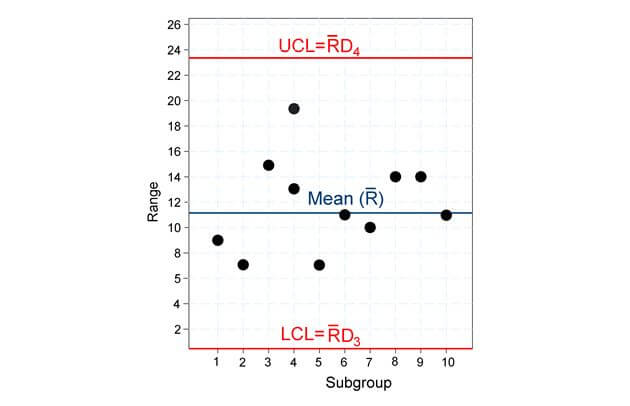
Figure 12: This figure shows the mean range value and the upper control limit and lower control limits based on the control factors and the previous equations.
X-Bar Chart
The X-Bar chart graphically shows the averages of each subgroup. The average of the averages is called the grand average and is shown as, X ̿. This value serves as the centerline of the graph. The upper and lower control limits are found through the following equations.
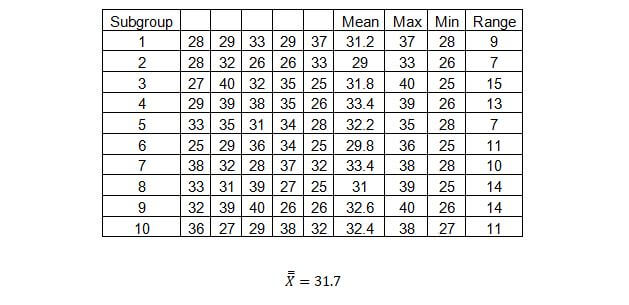
Next, in order to find the UCL and LCL, you must use the following equations.

You should notice that the sample size is 5, thus the corresponding factor is as shown below:
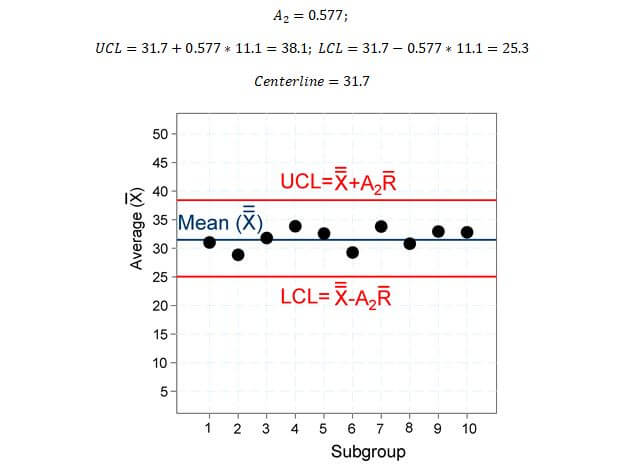
Figure 13: This figure plots the average values for each subgroup. The grand average, UCL and LCL values are also shown with their equations.
s-Chart
The s-chart plots the standard deviation values for each subgroup. The mean of the standard deviations (s ̅) is plotted as the centerline. The UCL and LCL lines are plotted in accordance with the below equations.

Another version of the X-Bar chart can also be plotted with the following equations.

Economic Analysis
As a professional engineer, you will be tasked with determining the course of action for a design. Often times this will entail choosing one alternative instead of several other design alternatives. Engineers need to be able to present engineering economic analysis to their clients in order to justify why a certain alternative is more financially sound than other alternatives. The following sub-sections will present the engineering economic concepts that should be understood by the engineer and does not present a comprehensive look into the study of engineering economics.
The information shown on this website is a sample of the material provided in the technical study guide and sample exam. See the STORE to buy the products for continuation on Economic Analysis and Basic Engineering Practice for the Mechanical Machine Design & Materials PE Exam.
Project Management
As a professional engineer, you will be tasked with determining the course of action for a design. Often times this will entail choosing one alternative instead of several other design alternatives, this can be based on the economics of the various alternatives which was previously discussed. But when you have selected a design, you can optimize the design with proper project management. One technique that is easily tested is critical path project management.
The information shown on this website is a sample of the material provided in the technical study guide and sample exam. See the STORE to buy the products for continuation on Project Management and Basic Engineering Practice for the Mechanical Machine Design & Materials PE Exam.
Units and Conversions
References
Many of the problems on the PE exam will require you to convert units and will have incorrect answers that use different units or wrong conversion techniques. Double check your work and make sure you use the correct units.
Use your Engineering Unit Conversions book.
The Engineering Unit Conversions book is a must have for nearly all questions in the exam. This book has all the common unit conversions used in the PE exam and this book makes it very easy to convert from one unit to the next.
Amazon Link: Engineering Unit Conversions
Dimensional Analysis
Dimensional analysis should be used to solve the units and conversion problems on the PE exam. Dimensional analysis is the analysis of the units of different attributes in their lowest fundamental terms. This technique breaks down the dimensions (length, mass or time) into fundamental dimensions like pounds instead of tons or grams instead of kilograms or kilograms-meter per second squared instead of Newtons. Then the units can be simplified and converted using basic algebra. This technique can also be called factor-label or unit-factor.
The information shown on this website is a sample of the material provided in the technical study guide and sample exam. See the STORE to buy the products for continuation on Units & Conversions and Basic Engineering Practice for the Mechanical Machine Design & Materials PE Exam.