![]()
Engineering Pro Guides is your guide to passing the Mechanical & Electrical PE and FE Exams
Engineering Pro Guides provides mechanical and electrical PE and FE exam technical study guides, practice exams and much more. Contact Justin for more information.
Email: contact@engproguides.com
FE EXAM TOOLS
Computational Tools for the
Mechanical FE Exam
1.0 Introduction
Computational Tools accounts for approximately 3 to 5 questions on the Mechanical FE exam. This section covers the basic tools for performing engineering calculations. These are engineering computational and Boolean logic skills that are required for Microsoft Excel® and other programs. Flow charts can be found in the “Electrical and Computer Engineering” section of the NCEES FE Reference Handbook.
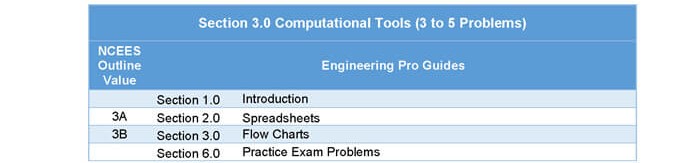
2.0 Spreadsheets
Spreadsheets refer to commonly used formulas that are used in Microsoft Excel® or other similar computational programs. The basic operations and commands are not included in the NCEES FE Reference Handbook, but rather are understood to be used in everyday practice. The intent of spreadsheets is to simplify the calculations, increase computational efficiency, be able to quickly change variables and outputs, and to output data in a presentable format. The other benefit of spreadsheets is being able to compute results for multiple input data either in list or array format.
2.1 CELLS
A spreadsheet consists of an array of cells labeled by a letter for each column and a number for each row. A specific cell is identified by a letter-number combination. For example, the cells with an x is labeled A1, the cell with xx is labeled B2, and the cell with xxx is labeled D5.

Within each cell, a text, number, or formula can be inserted. A text is a string of letters, a number is a numerical value, and a formula is used for mathematical or logic operations.
2.2 COMMON OPERATIONS
The following are common mathematical formulas and operations used in spreadsheets. A formula use numbers or reference cells in an operation.
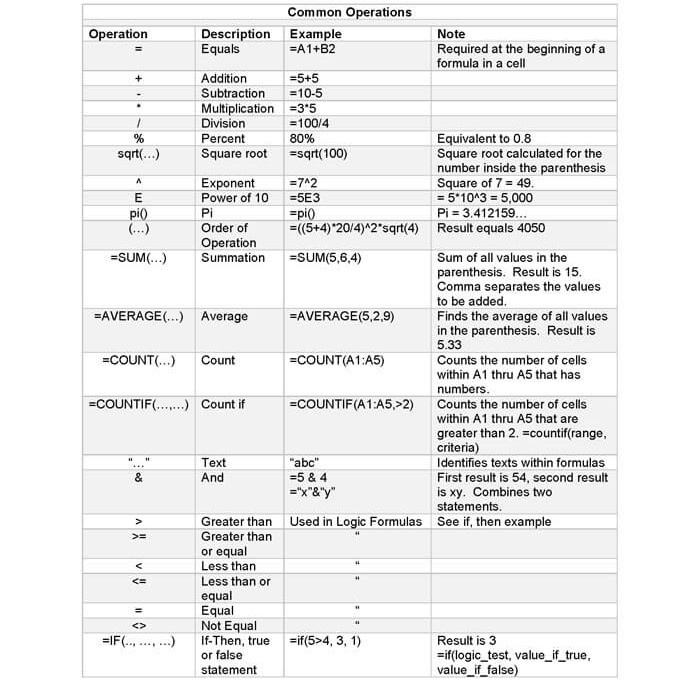
See below for examples of these operations used within a spreadsheet layout.
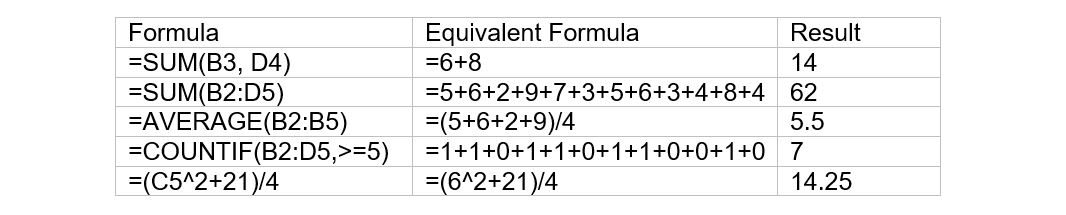
Example: Use the table below to solve for the results of the following formulas.

Solution: The following formulas yield the following results.
2.3 RELATIVE, ABSOLUTE, AND MIXED REFERENCE
For ease of populating spreadsheets, a cell’s position is relative to referenced cells. Refer to the spreadsheet used in the example above. Assume cell E2 was populated with the formula =B2+C2+D2. If cell E2 was copied and pasted into E3, then the formula would change to references are in a relative position to the new cell E3. The formula in E3 would result in =B3+C3+D3. If E2 was copied, then pasted into E4, then the formula in E4 would be shifted two rows down and become =B4+C4+D4. If E2 was copied, then pasted into F2, then the references would shift right and the formula in F2 would be =C2+D2+E2.
To lock the position of a reference, it can be converted to an absolute reference by adding dollar signs before the reference letter and number. In the example above, change the formula in E2 so that B2 becomes an absolute reference. The new formula becomes =$B$2+C2+D2. Then, when E2 is copied into F4, the reference B2 remains locked and the formula in F4 is =$B$2+D4+E4.
It is possible to freeze just the row or the columns of a reference. This is called a mix reference. Adding a dollar sign before the letter locks the referenced column and a dollar sign before the number locks the referenced row. For example, assume the formula in E2 is B$2+C2+D4. If E2 is copied into F2, then the formula becomes =C$2+D2+E2. If E2 is copied into E3, then the formula becomes =B$2+C3+D3, since row 2 in the first reference remains locked. Similar rules apply when B2 becomes the mixed reference $B2 instead.
3.0 Flow Charts
In mechanical engineering, flow charts are used in decision making processes and for determining the course of action for a design. Often times this will entail choosing one alternative instead of several other design alternatives, which can be based on the economics of the various alternatives. When you have selected a design, you can also optimize the design with proper project management. Other ways flow charts are used include system level charts that show how resources flow, program flow charts that are used in controls logic, data flow charts that show data movement, and document flow. Two techniques that can easily be tested are logic flow charts and the critical path method.
3.1 LOGIC BASED FLOW CHARTS
Flow charts can be represented with words to lay out a project workflow or be represented as mathematical and logical expressions for computer based algorithms. The FE will most likely test you on the latter, which is essentially a test on basic computer programming. The intent is to confirm that as an engineer, you are capable of following simple computer programming and flow chart logic. Remember that these questions will not be too complicated. In fact, you should be able to intuitively solve these problems. Since each programming language varies, the test will only use the very basic and commonly understood commands. Commands will be represented in line by line syntax format or diagrammatic flow charts.
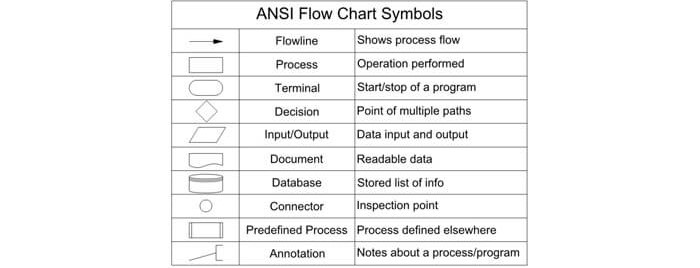
3.1.1 Flow Chart Symbols
The following symbols are based on the American National Standards Institute (ANSI) and the International Organization for Standardization (ISO) standards for flow chart symbols. These can be found under the “Flow Chart Definition” section of the Electrical and Computer Engineering chapter in the NCEES FE Reference Handbook.
3.1.2 Variables, Constants, and Formulas
The first of the computer or logic based commands is defining a variable or a constant. A variable or constant is an identifier that is defined as a numerical value, typically variables or constants are only letters. For example, A=5 means that the variable A is assigned to be equal to the number 5. The difference between a variable and a constant is that a variable can be changed throughout the program, but a constant cannot. Once the variable is defined, it can be used within a “process” or a formula. A formula will use mathematical operations, such as addition, multiplication, square root, sine, cosine, logarithm, etc.
Example
A = 5;
Constant pi = 3.14;
A=5 +1
;B=A^2*pi;
Solution: Initially A is defined as a variable, equal to the number 5. At the end of the program, variable A is redefined as the number 6. The constant pi will remain 3.14 throughout the program. Variable B is equal to 6^2*3.14 = 113.
3.1.3 Logic Statements
The fundamental component of flow charts is the use of logic statements. Logic statements are used to determine which direction the flow chart should proceed. In the following examples, you should be able to follow the flow of commands in either the syntax form or the diagrammatic form.
"If” statements: If-statements will start with a tested expression. If the expression is true, it will perform the process included within the if-statement, if it is false, then it will proceed around the process included in the if-statement.
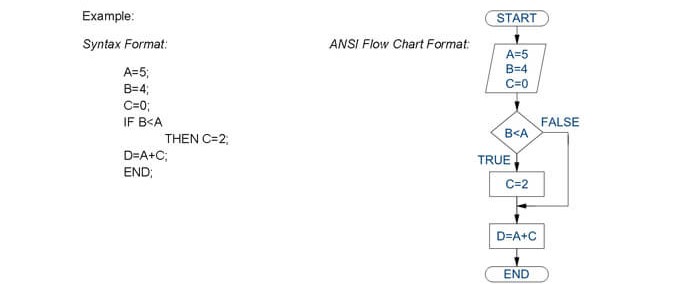
Solution: In the above command, the expression within the “if” statement: B less than A is true, therefore C=2 and the program proceeds to compute D=7. Let’s assume that B was equal to 6 instead of 4. Then the statement B less than A would be false and the program would skip of over the C=2 command. C would remain being equal to 0 and the result would be D=5.
"If-Else” statements: If-else statements will start with a tested expression. If the expression is true, it will perform the process included within the if-statement, if it is false, then it will proceed to the process within the else statement. Then the flow will continue to the next commands outside of the if-else statement.
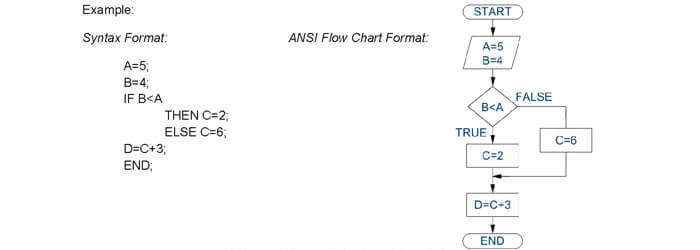
Solution: In the flow chart above, B less than A, therefore C=2 and the program skips over the “else” statement. The program ends with D=5. Again, for arguments sake, let’s assume that B was 6 instead of 4. Then, B less than A is a false statement, so the program will skip over the “then” statement and proceeds to the “end” statement, where C=6. The program ends with D=9.
“Loop” statements: In programming, loop statements come in the form of “for”, “while” and “do-while” loops. Differentiating the three will require additional syntax that will unlikely be tested. The test is more concerned with flow rather than syntax, so the syntax itself should be intuitive. The important concept to understand is that in a general looping scheme, a command is continually repeated within a loop until a test expression is satisfied. The test expression is located within the loop command and is also continuously updated.
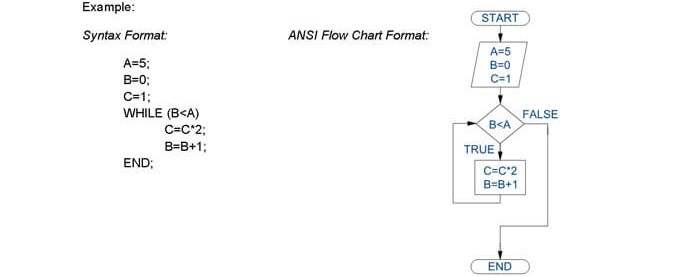
Solution: In the example above, a loop continues under the while command until B less than A is no longer true. The initial flow begins with A=5, B=0, and C=1. The test statement B less than A is true, so the commands C=C*2 and B=B+1 are executed. In the first pass, C=2 and B=1. The loop continues four more times (5 passes total) until B=5 and C=32. On the sixth pass, B=5 and the test statement B less than A is no longer true, the command jumps over the while loop, and the program ends.
3.2 CRITICAL PATH PROJECT FLOW CHART
One application of flow charts is finding the critical path in a project and understanding the effects of delays on tasks within the critical path and outside of the critical path. On the exam each task of a project will most likely be given and the time it takes to complete each task. In addition, each task will have its dependencies that must be completed prior to the task being started. The best way to understand how to complete these types of problems is to go through a sample problem, step by step.
The following is a table of various tasks and their durations, along with what tasks must be completed before a task begins.
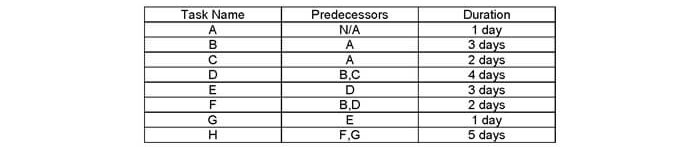
The first step is to pick the task(s) that have no predecessors and draw these tasks on the left side of your paper. The understanding is that the progression of the project will proceed from left to right. The only task without a predecessor is task A. This task serves as your starting point. Next find the tasks that lead from A, which are B and C. Next, follow the same steps for tasks B, C and the rest of the tasks. Your final figure should have the following connections shown on the diagram below.

Figure 1: Project work flow diagram for example problem.
The next step is to create all the possible paths and determine the total number of days for each path.

The critical path is “A-B-D-E-G-H”. This is also the total length of the project. Thus if any delay or improvement occurs to this path, then the total length of project will change. If a change occurs in a task not included in this path like C or F, then the total length of the project may or may not change, depending on the severity of the change.
4.0 Practice Problems
4.1 PRACTICE PROBLEM 1 - SPREADSHEETS
In the spreadsheet below, cell D4 contains the formula “=$B4/(pi()*C4^2/4)” is copied over to cell F2. What is the value in cell F2?

(A) 0.7
(B) 1.5
(C) 3.0
(D) 5.9
4.2 PRACTICE PROBLEM 2 – SPREADSHEETS
The formula in cell C4 is “=IF(AND(B1<>5,B2<0,B3>=0),3,1)” and the formula in C5 reads “=C4*1E3”. What is the numerical result in cell C5?
(A) -3
(B) -9
(C) 1000
(D) 3000