- HOME
- FE EXAM
- PE EXAM
- DESIGN TOOLS
- COURSES
- STORE
- ABOUT
- CONSULTING
![]()
Engineering Pro Guides is your guide to passing the Mechanical & Electrical PE and FE Exams
Engineering Pro Guides provides mechanical and electrical PE and FE exam technical study guides, practice exams and much more. Contact Justin for more information.
Email: contact@engproguides.com
FE EXAM TOOLS
Material Properties & Processing for the
Mechanical FE Exam
by Justin Kauwale, P.E.
1.0 Introduction
Material Properties and Processing accounts for approximately 8 to 12 questions on the Mechanical FE exam. This section works in conjunction with Section 10 Mechanics of Materials. The Material Properties part covers the mechanical properties covered in Section 10 and other material properties like chemical, electrical and physical types. This section then covers the material processing, material types, phase diagrams and other material issues like corrosion, fatigue and cracks. There are a few pages on Material Properties & Processing in the NCES FE Reference Handbook that you should be familiar with in order to pass the FE exam. However, in order to use those pages you need to understand the concepts and skills presented in this section.
2.0 Material Properties
2.1 CHEMICAL
A chemical property is the property of a material that undergoes change in its chemical structure during a chemical reaction. An important chemical property is corrosion, which will be discussed later in this section
.2.2 ELECTRICAL
The important electrical properties of materials are conductivity and capacitance. The conductivity describes the material’s ability to conduct electricity and capacitance describes the material’s ability to hold a charge. Conductivity is often expressed as its inverse, which is called resistivity. This is the material’s ability to resist an electrical current.

Resistivity is used to calculate the resistance of an object like a copper wire. Resistance is given in units of ohms and is a function of the material’s resistivity, the cross sectional area of the material and the length of the material.

2.3 MECHANICAL
The mechanical properties of materials are found by a series of tests. These tests include the tension or compression test, which determines the Stress-Strain diagram. The Rockwell or Brinell tests determine the hardness of the material. There are also many more tests that determine the other properties like creep, thermal expansion, thermal conductive, specific heat capacity and visco-elasticity. Each of the mechanical material properties will be discussed in the next paragraphs.
2.3.1 Strength
Strength is covered in Topic 3.0 Stress-Strain Diagrams.
2.3.2 Hardness
Hardness is the property that describes a material’s ability to withstand abrasion, scratching and indentation. Hardness is measured in terms of MPa or is a dimensionless value. The hardness measurements are useful when comparing one material to another.
Hardness is measured by any one of the following tests, (1) Rockwell, (2) Brinell, (3) Meyer, (4) Vickers, (5) Knoop or (6) Scleroscope. Each of these tests use a different object of varying shape and material to impact the subject material. The effect of this impact due to a known force is then measured and a hardness value is assigned. The two main tests that you should know for the FE exam are Rockwell and Brinell. You should also know that hardness values are not absolute, these tested values are relative to each other. Hardness values are used to compare the hardness between different materials.

Figure 1: Hardness tests involve a known load impacting a material’s surface and the measurement of the load and the result of the impact upon the material’s surface.
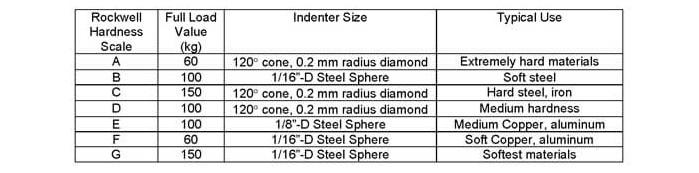
2.3.1 Rockwell
The Rockwell hardness test is the most popular test. In this test, an indenter is first used as a pre-load to remove any effects of the surface finish and then the full load is used to indent the material. The depth of the indentation determines the Rockwell hardness value. This test has different scales based on the size of the indenter used to impact the test material. The scales range from A through G. Each scale is used for different types of materials. A summary of the scales are shown below.
The hardness number is then determined by measuring the thickness of the indent made into the material and inserting this value into one of the following equations.

2.3.2 Brinell
The Brinell hardness test is another popular hardness test method. This test uses a 10-mm diameter steel ball and a 3,000 kg force. As the materials get softer, a smaller force is used and for harder materials, a tungsten carbide ball is used instead of steel.

There is a rough relationship between the Brinell Harness Number and the tensile stress of a material, which is shown with the equation below.
2.4 PHYSICAL
During the exam you will need to be able to find and use material properties to complete many problems. You should be very familiar with your resources and where to find these material properties. As you go through these descriptions of the important material properties, look through the NCEES FE Reference Handbook so you can become familiar with the available properties and the units.
2.4.1 Density
The density of a substance is its mass per unit volume, basically how heavy is something in one cubic foot or one cubic meter.

The density is typically used to calculate the overall weight of a material based on its volume. The table below lists densities of common metals. You may find that different sources have varying densities for metal alloys. Therefore, it is likely that the test will provide you with the density values when referencing an alloy to avoid possible discrepancies.

Specific volume is the inverse of density and is measures as a volume per unit mass.

2.4.2 Melting Point
The melting point is the temperature at which a solid will turn into a liquid at atmospheric pressure. An alloy may have two melting points, solidus and liquidus. Solidus is the temperature at which the metal turns from completely solid to a solid and liquid mixture. Liquidus is the temperature at which the metal turns from a solid and liquid mixture to completely liquid. The eutectic point is a specific composition where the metal transitions from completely solid to completely liquid.
The following figure is a phase diagram for a copper-silver alloy and depicts an example of the solidus and liquidus melting temperatures for various alloy compositions. Observe the eutectic point at approximate 28% copper. The phase diagram will be discussed more later on in the heat treatment topic.
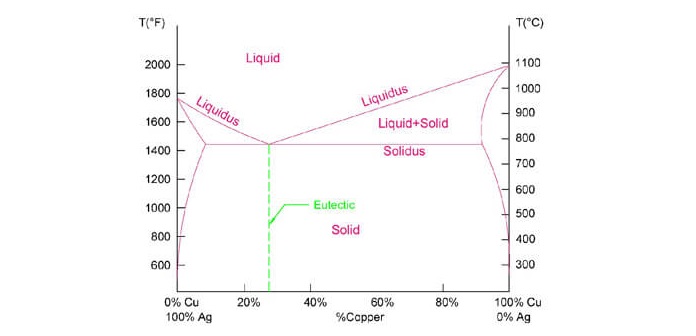
Figure 2: Phase diagram of Solidus and Liquidus Melting Points
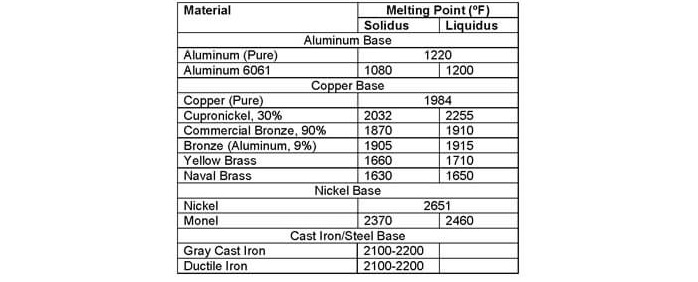
The following table list melting points for common metals. Alloys have a solidus and liquidus melting point as described above.
2.4.3 Optical
There are four major optical properties of a material: reflectance, transmittance, absorbance, and emissivity. When a beam of light hits a solid object, it is either reflected, transmitted or absorbed. The sum of the reflectance, transmittance, and absorption is equal to the incoming light, also known as incident light. Emissivity is how much light can be radiated by an object and is expressed as a ratio to a perfect black body.

Figure 3: Reflected, Transmitted, and Absorbed Light
2.4.3.1 REFLECTANCE
Reflectance is the amount of light that is reflected back from the object. A mirror has high reflectivity, low transmissivity, and low absorptivity
2.4.3.2 TRANSMITTANCE
Transmittance is the amount of light that goes through the material. For example, glass has a high transmittance, but low reflectivity and low absorptivity.
2.4.3.3 ABSORBANCE
Absorptivity is the amount of light that gets absorbed into a material. Opaque and dark objects have higher absorption. Asphalt has a high absorptivity.
2.4.3.3 EMITTANCE
The incident light or energy that is absorbed into an object can then be emitted from it. Emissivity is how much thermal radiation in the form of light and infrared radiation is emitted from an object compared to a perfect black body. A perfect black body is an object that can absorb 100% of the incoming light, and also emit 100% of this absorbed energy.
2.5 THERMAL
2.5.1 Thermal Expansion
When heat is added to most materials, the average amplitude of the atoms' vibrating within the material increases. This, in turn, increases the separation between the atoms causing the material to expand. If the material does not go through a phase change, the expansion can be easily related to the temperature change. The linear coefficient of thermal expansion (α) describes the relative change in length of a material per degree temperature change. As shown in the following equation, α is the ratio of change in length (∆l) to the total starting length (li) and change in temperature (∆T).
This section is discussed in more detail in the technical study guide.
2.5.2 Thermal Conductivity
Thermal conductivity is the ability of a material to conduct heat with a given temperature difference. Thermal conductivity is the material property that measures the rate of change in heat per unit distance per unit temperature difference.
This section is discussed in more detail in the technical study guide.
2.5.3 Specific Heat Capacity
The specific heat describes the ease of a fluid or solid to increase in temperature when heat is applied. Specific heat is also known as heat capacitance and can be thought of as an object’s ability to hold and gain heat. For solids and liquids, specific heat is shown as the variable, c¬p.
This section is discussed in more detail in the technical study guide.
3.0 Stress-Strain Diagrams
The tension and compression tests determine the strain at various stress levels. This results in the stress-strain diagram. A sample of the stress strain diagram is shown below.
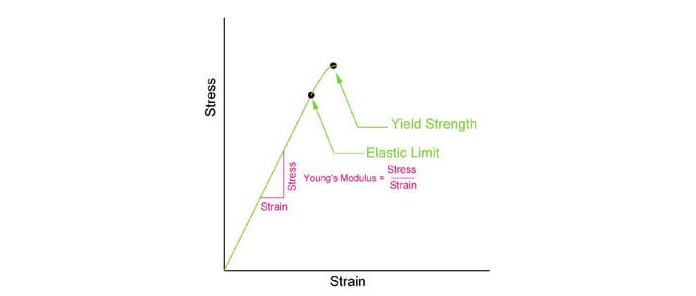
Figure 6: The stress-strain graph is produced through a series of test. A known force is applied to a known area and the strain is measured. The stress is found by dividing the force by the area. Once certain requirements like yield strength and ultimate strength are met, this stress level is recorded. This graph is for a typical brittle material.
33.1 YOUNG’S MODULUS
The modulus of elasticity, which is also known as the Young’s Modulus, describes the slope of the stress to strain in the linear portion of the stress-strain graph. This modulus of elasticity has units of psi or MPA.

3.2 ELASTIC LIMIT
The elastic limit is the stress level at which permanent deformation will occur. This point is not often used due to the difficulty in measuring this point. Elastic limit is the first stress level when bonds are broken and the first point at which permanent deformation occurs. Since it is difficult to measure this exact stress point, yield strength is often used.
3.3 YIELD STRENGTH
The yield strength is similar to the elastic limit, but instead of any permanent deformation a specified permanent deformation must be reached in order to be called the yield strength. The typical specified permanent deformation amount is 0.2%. This value was used often in Section 9.0 Mechanics of Materials.
3.4 PROPORTIONAL LIMIT
The proportional limit is not used as often, but you should still be familiar with this point on the stress-strain graph. This point describes the point at which the stress-strain graph no longer moves in a straight line.
3.5 SHEAR MODULUS
Another stress-strain diagram is the shear stress-strain diagram. This diagram is constructed similar to the stress-strain diagram, except shear stress is applied to the material.
The shear modulus is given the variable, “G”. It describes the material’s ability to resist shearing. It also is the slope of the line on the shear stress-strain diagram, remember that this slope is only at the linear portion of the graph.

3.6 POISSON’S RATIO
The Shear Modulus and Young’s Modulus described the relationship between an applied stress and the strain in either the plane normal to the surface (Young’s Modulus) or plane parallel to the surface (Shear Modulus). These two strains are related by the Poisson’s ratio. When a force is applied in the axial direction in either compression or tension, then there will be a relationship between the strain developed in the lateral and axial direction. Please see the following figures that show an object under tension and compression.

Figure 7: When an object is compressed the length of the object in the axial direction and the lateral direction will be changed. The gray colored object is the original object dimensions and the brown object is the new objected after it undergoes a compression force. Please remember the axial strain and lateral strain shown in the diagram is only ½ the total strain.
The relationship between the axial strain and lateral strain is a property of the material called the Poisson’s ratio.
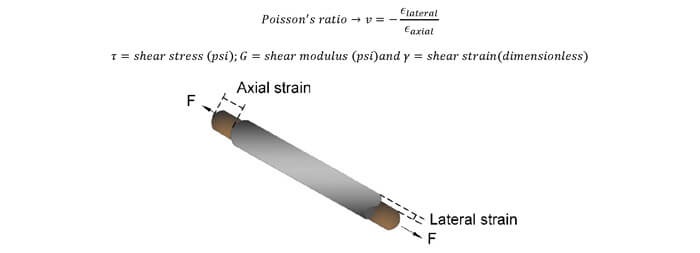
Figure 8: When an object undergoes tension the length of the object in the axial direction and the lateral direction will be changed. The gray colored object is the original object dimensions and the brown object is the new objected after it undergoes a tension force. Please remember the axial strain and lateral strain shown in the diagram is only ½ the total strain.

3.7 ULTIMATE TENSILE STRENGTH
Ultimate tensile strength (UTS) is defined as the maximum amount of stress due to tension prior to breaking. Brittle materials and ductile materials both have ultimate strength values, but UTS occurs much closer to yield strength for brittle materials. Most often, yield strength can be approximated as the ultimate tensile strength. Ductile materials have UTS values that are much higher than their yield strength values. Once a ductile material yields, then it can still withstand stress until it breaks.
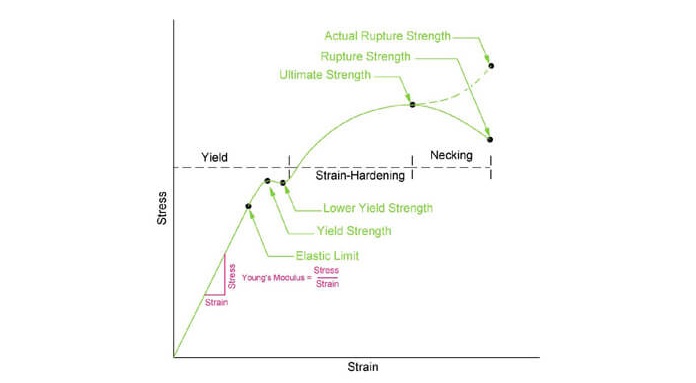
Figure 9: This graph shows the various material properties for a ductile material.
Rupture strength is shown on the previous figure. The difference between rupture strength and ultimate strength is that ultimate strength assumes that the stress applied is solely tensile. The individual fibers within the material are all subject to the same tensile stress. The individual fibers do not all have the same strength capabilities, thus the weakest fiber will fail at a lower stress level and this will determine the ultimate tensile stress.
Rupture strength is the complete breakage of the material, indicating that all the fibers are broken. In actuality this may occur at a large stress value, but in design it is assumed that the rupture strength is less than the ultimate strength because once the weak fibers have failed, the other fibers will have more stress and will fail as well.
This section is discussed in more detail in the technical study guide.
4.0 Engineered Materials
4.1 ALLOYS
Alloys are created to produce a material with improved characteristics for a specific application. Alloys consist of a mixture of metals and sometimes employ other elements. A common FE problem will be to determine the correct alloy for a desired requirement, like meeting a physical or chemical requirement, such as strength or corrosion resistance. Since steel alloys are the most common in the Machine Design & Materials field, you will most likely have a question on steel alloys with respect to their differing material properties.
This section is discussed in more detail in the technical study guide.
5.0 Ferrous Metals
Ferrous metals contain iron (ferrite). These metals include steel, carbon steel, cast iron, etc. The iron makes these metals harder and much more durable. However, the iron also causes the metal to be more susceptible to corrosion.
This section is discussed in more detail in the technical study guide.
6.0 Nonferrous Metals
Nonferrous metals do not contain iron (ferrite). Common nonferrous metals include aluminum and copper. These metals are softer and less durable, but these metals are not as susceptible to corrosion.
This section is discussed in more detail in the technical study guide.
7.0 Manufacturing Processes
For the purposes of the FE exam, you should not need to be familiar with the details of the manufacturing processes as if you were in the manufacturing field. This is because the manufacturing processes category is vast and there is little information on manufacturing processes in the NCEES FE Reference Handbook. The three main Manufacturing Processes discussed in this book are, (1) Machining, (2) Molding and (3) Heat Treatment.
7.1 MACHINING
This section is discussed in more detail in the technical study guide.
7.2 MOLDING
This section is discussed in more detail in the technical study guide.
7.3 HEAT TREATMENT
This section is discussed in more detail in the technical study guide.
8.0 Phase Diagrams
A basic skill that you should know for the FE exam is how to read phase diagrams. A phase diagram graphically represents the state of a material at varying conditions (i.e. temperature, pressure, composition, etc.). For machine design, the most relevant type of phase diagram is the binary phase diagram. Binary phase diagrams are used to identify the properties of an alloy based on the temperature and composition of the material. The image below is an example of the simplest phase diagrams: Copper-Nickel.
This section is discussed in more detail in the technical study guide.
8.1 READING A PHASE DIAGRAM
This section is discussed in more detail in the technical study guide.
8.2 LEVER RULE
This section is discussed in more detail in the technical study guide.
8.3 IRON-CARBIDE DIAGRAM
This section is discussed in more detail in the technical study guide.
9.0 Phase Transformation, Equilibrium and Heat Treating
This topic focuses on the process of heat treatment. Heat-treating is the process of heating metals to specific temperatures at specific rates in order to change the performance and material properties of the metal. This is done by changing the microstructure of the metal and/or the composition. The chemistry that takes place and the details in the microstructure is outside the scope of the FE exam. For the exam, you should be focused on the most popular heat treatment methods and should have a general concept of these processes. The major heat treatment processes are annealing, hardening, strengthening, tempering and quenching. These processes generally either make materials softer or harder, stronger or weaker, ductile or brittle.
This section is discussed in more detail in the technical study guide.
9.1 ANNEALING
This section is discussed in more detail in the technical study guide.
9.2 TIME TEMPERATURE TRANSFORMATION GRAPH
This section is discussed in more detail in the technical study guide.
9.3 HARDENING & QUENCHING
This section is discussed in more detail in the technical study guide.
9.4 TEMPERING
This section is discussed in more detail in the technical study guide.
10.0 Materials Selection
For materials selection type questions, you should be familiar with the material properties presented throughout this section. You need to be able to determine which of the materials presented in the problem or in the NCEES FE Reference Handbook have the properties necessary to meet the requirements of the question.
This section is discussed in more detail in the technical study guide.
11.0 Surface Conditions
Surface finishes can be important for the fits and tolerances of components, because the roughness of a component’s surface may affect the tolerance of the component. If a tight tolerance is required, then the roughness should be minimized. Also if a figure is rough, then it will affect the straightness of the surface. The following method is used to specify the roughness for a component. The roughness value, #3, is shown in units, μm.
This section is discussed in more detail in the technical study guide.
12.0 Corrosion Mechanisms and Control
Corrosion is the deterioration of a material over time. Corrosion is accelerated when exposed to hostile environments or in contact with certain materials. Being able to understand which metals are more or less susceptible to corrosion is important for selection of materials in varying machine design applications.
12.1 CORROSION RATES
The corrosion rate is determined by the thickness surface deterioration over time, typically measured in mils/year, where 1 mil = 0.0254 mm or one-thousandth of an inch (.001 in)
Corrosion rates are measured by finding the weight difference of a metal over time to calculate the material loss.
This section is discussed in more detail in the technical study guide.
12.2 GALVANIC SERIES
This section is discussed in more detail in the technical study guide.
12.3 CORROSION PROTECTION
This section is discussed in more detail in the technical study guide.
12.4 OXIDATION
The corrosion of metals does not always require a liquid to promote the electrochemical reaction. Oxidation is the act of corrosion in gas and for the purposes of the exam the gas will be air. It will be difficult to test this topic numerically, but you should be familiar with the overall concept of oxidation and chemically how oxidation occurs.
A metal with two electrons (divalent) will be combined with ½ oxygen molecule to form a metal-oxide.
This section is discussed in more detail in the technical study guide.
13.0 Thermal Failure
Thermal failure can occur due to the material heating or cooling such that the material properties are outside of the requirements necessary to prevent failure. Another example of thermal failure occurs in the fatigue topic in Section 9.0 Mechanics of Materials. A material may repeatedly expand and contract due to thermal changes, which will eventually cause the material to fail due to fatigue.
This section is discussed in more detail in the technical study guide.
13.1 CREEP
Another concept that you should understand which is influenced by temperature is called Creep. The term creep strength, describes a materials ability to withstand a constant load. This term is similar to the fatigue term, which will be discussed later. Fatigue is concerned with repeating, on-off loads, while creep is concerned with steady, always on load. Creep strength is the stress level at which a material will fail at a certain time and certain temperature. This stress is typically less than the yield strength of the material. This is why it is important to understand creep when selecting a material to ensure that your design takes into account the long term effects of creep. You may select a material that meets the yield strength for the current design situation, but over time creep will occur and the material may fail. In practice, creep is taken into account by assigning a safety factor to the yield strength and in more sensitive situations, your design should include the lifetime of the material and the creep strength.
This section is discussed in more detail in the technical study guide.
14.0 Ductile or Brittle Behavior
Ductile materials will plastically deform as opposed to break when subject to stress. Brittle material will not deform, nor will it absorb any energy prior to breaking. Brittle material will also undergo less strain prior to breaking.
This section is discussed in more detail in the technical study guide.
15.0 Fatigue
The stress, strain, shear, bending, buckling and torsion topics discussed the strength of materials based on a maximum one-time load. However, the strength of materials is not only characterized by this maximum loading but also by the maximum cycles of repeated loading. Fatigue describes the relationship between cycles of loading and the magnitude of the loading. A small load with a small number of cycles of applying this load will not fatigue an object but a large load with a large number of cycles of applying this load will fatigue an object.
This repeatedly applied load will cause the object to fail at typically a smaller value than the ultimate tensile strength or yield point, which was discussed earlier. This is why the study of fatigue in Machine Design and Materials is important. Fatigue typically occurs when objects are subject to cyclic loading throughout its life, where the stress on the object varies in a sinusoidal waveform from a maximum level in one direction and then a maximum level in the opposite direction.
The sinusoidal shape is not as important as is the maximum and minimum values of the shape. These maximum and minimum values determine the alternating stress and mean stress values. Alternating stress is defined as the difference between the maximum and minimum stress values acting upon the component. The mean stress is the average value of the stress values acting upon the component.
This section is discussed in more detail in the technical study guide.
15.1 GOODMAN DIAGRAM
The Goodman diagram is a graph of the mean stress vs. the alternating stress. The area under curve represents the combination of static stress and alternating stress that will not result in failure. The area outside of the curve represents combinations that will most likely result in failure of the material. The stresses shown on this Goodman Diagram are shown for stresses in the tensile direction.
This section is discussed in more detail in the technical study guide.
16.0 Crack Propagation
Crack propagation mainly deals with a subset of Fracture Mechanics. Fracture mechanics is a vast topic that covers the fact that a lot of failures of mechanical components do not result from a complete break, but from a fracture where a single crack or break in continuity of a component occurs. Once a crack or fracture appears, the strength of the component at that location becomes compromised. A component may have a certain strength value, but at that location the strength becomes much weaker and the stress that can cause failure is much less.
Cracks and fractures appear regularly in components and there was a need to be able to quantify and predict failure based on a fracture or crack. There are a couple of methods that are used to quantify the effect of cracks on the failure of a component, (1) the energy balance approach and (2) the stress intensity approach. The energy balance approach is not covered in this book, because the equations for this approach are not shown in the NCEES FE Reference Handbook.
The stress intensity approach is based on three types of stresses applied at various configurations to the crack.
This section is discussed in more detail in the technical study guide.
17.0 Practice Exam Problems
17.1 PRACTICE PROBLEM 1 – THERMAL STRESS
A steel rod with a diameter of 3” and at an initial temperature of 75 F is heated up to 180 F. What force must be applied to constrain the rod? α_steel=6.8 x 〖10〗^(-6) [in/(in-F)] and the modulus of elasticity equals 30 x 106. psi

a) 91 kips
b) 151 kips
c) 215 kips
d) 276 kips
17.2 PRACTICE PROBLEM 2 – MODULUS OF ELASTICITY
A post consists of 4 identical steel rods of an unknown diameter. The post is filled with concrete and has dimensions as shown below with a height of 10 ft. There is a force of 250 lbs acting upon the post. The modulus of elasticity of the steel is 30 x 106. psi and the modulus of elasticity of the concrete is 3 x 10⁶. The external force is shared equally between the 4 steel rods and the concrete. What is the diameter of the steel rods?

a) 2.6 in
b) 3.1 in
c) 4.5 in
d) 6 in
17.3 PRACTICE PROBLEM 3 – THERMAL CONDUCTIVITY
This section is discussed in more detail in the technical study guide.
17.4 PRACTICE PROBLEM 4 – STRESS-STRAIN
This section is discussed in more detail in the technical study guide.
17.5 PRACTICE PROBLEM 5 – STRESS-STRAIN
This section is discussed in more detail in the technical study guide.
17.6 PRACTICE PROBLEM 6 – ALLOYS
This section is discussed in more detail in the technical study guide.
17.7 PRACTICE PROBLEM 7 – FATIGUE
This section is discussed in more detail in the technical study guide.
17.8 PRACTICE PROBLEM 8 – FATIGUE
This section is discussed in more detail in the technical study guide.
17.9 PRACTICE PROBLEM 9 – FATIGUE
This section is discussed in more detail in the technical study guide.
17.10 PRACTICE PROBLEM 10 – POISSON’S RATIO
This section is discussed in more detail in the technical study guide.
17.11 PRACTICE PROBLEM 11 – CRACK PROPAGATION
This section is discussed in more detail in the technical study guide.
17.12 PRACTICE PROBLEM 12 – CRACK PROPAGATION
This section is discussed in more detail in the technical study guide.