- HOME
- FE EXAM
- PE EXAM
- DESIGN TOOLS
- COURSES
- STORE
- ABOUT
- CONSULTING
![]()
Engineering Pro Guides is your guide to passing the Mechanical & Electrical PE and FE Exams
Engineering Pro Guides provides mechanical and electrical PE and FE exam technical study guides, practice exams and much more. Contact Justin for more information.
Email: contact@engproguides.com
FE EXAM TOOLS
Thermodynamics for the
Mechanical FE Exam
by Justin Kauwale, P.E.
1.0 Introduction
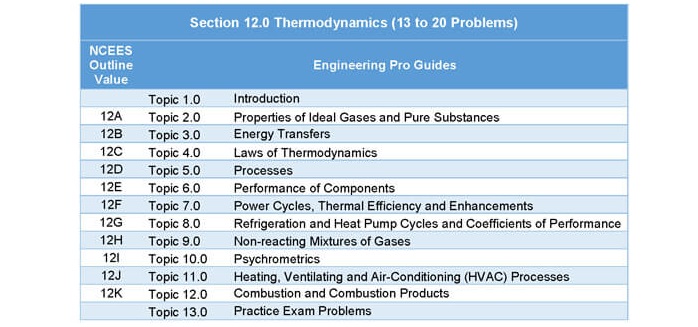
Thermodynamics accounts for approximately 13 to 20 questions on the FE Mechanical exam. Thermodynamics is the largest topic on the FE Mechanical Exam. It contains so much information that most Mechanical Engineering college courses do not cover all of this information within their entire Mechanical Engineering degree course curriculum. 12G, 12I, 12J are most often left out of Thermodynamic college courses. In addition, many college courses cover a lot of theory and do not focus on the key concepts and skills that are necessary for practical application of the theory. The following list is the outline of the Thermodynamics topics that can appear on the exam. This section will go into detail on the key concepts and skills that are necessary under each topic. Following, the key concepts and skills there will be problems that you can use to test your understanding of the concepts and skills.
2.0 Properties of Ideal Gases & Pure Substance
On the exam, you should be able to find thermodynamic properties very easily through the use of your thermodynamic property tables for given fluids, located in your Mechanical Engineering Reference Manual or Schaum’s Thermodynamics for Engineers. These properties are the building blocks for solving the problems on the exam. You should also have a concept of what these properties mean in the real world. These concepts will help to reality check your answers, instead of blindly following the results of your equations. Hopefully, this helps you to catch any math errors and speeds up your elimination of incorrect multiple choice answers.
Pressure
Pressure is one of the two most likely properties that you will start off with in a real world situation, because pressure is a thermodynamic property that is easily measured.

The pressure of a fluid indicates the amount of force per unit area that the fluid imparts on the materials around it. Pressure is typically measured in units of pounds per square inch (psi= lbf/(square inch)) . There are two different types of pressure scales, (1) absolute pressure and (2) gauge pressure. These two pressure scales differ by their 0 reference point. Gauge pressures have a 0-reference point as 1 atm. Thus 0 psig, where the “g” indicates gauge pressure, is equal to 1 atmospheric or 14.7 psia, where the “a” indicates absolute pressure. Most real world applications encountered by practicing engineers will have pressures indicated in gauge pressure. These include pressures measured at the discharge and intake of pumps and fans and the pressures measured at other pieces of equipment like heat exchangers, chillers and cooling towers. The relationship between gauge and atmospheric pressure is shown with the following equation and figure.

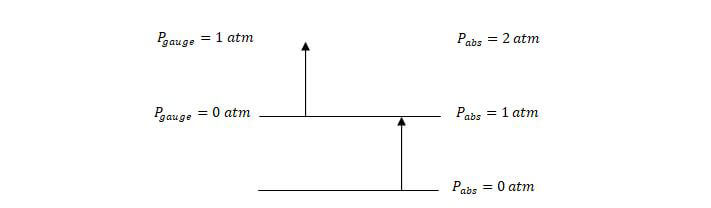
The relationship between gauge and absolute pressures, gauge pressure on the left and absolute pressure is shown on the right. See technical study guide for continuation.
Temperature
Temperature is the second property that you will start off with in a real world situation, because temperature is easy to measure.

This property is the one most people are familiar with, because it is displayed on thermostats and thermometers. Temperature is a direct indication of the amount of heat in the fluid. The United States Customary Systems (USCS) units used for temperature are Fahrenheit and Rankine. Typical Fahrenheit temperatures for chilled water (medium used for water-cooled air conditioning) range from 45 F to 55 F and hot water temperatures range from 120 F to 140 F. The temperature at which water boils is 212 F and water freezes at 32 F.
Rankine temperatures are used when it is necessary to define an absolute temperature scale having only positive values. The conversion between Fahrenheit and Rankine is shown below. When using equations during the exam, ensure that the correct temperature units are used. Always double check the required units for your equation.

Enthalpy
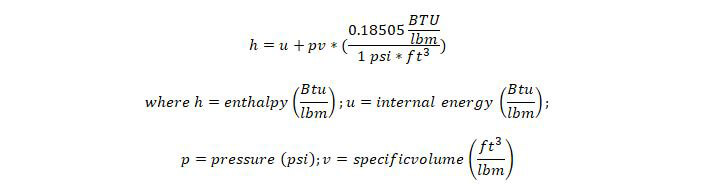
Enthalpy describes the amount of energy in a system. This property is used extensively in the Energy/Power applications. It defines the entering and leaving energy of a fluid through a system. On the exam, enthalpy refers to total enthalpy. Total enthalpy is equal to the internal energy of the fluid plus the energy due to pressure-volume.
See technical study guide for a continued discussion on Enthalpy.
Entropy
See technical study guide for the section on entropy.
Specific Heat
See technical study guide for the section on Specific Heat.
3.0 Energy Transfers (Energy Balances)
A key concept in Thermodynamics is that energy is not created or destroyed in a closed system. This is called the first law of Thermodynamics. This concept is used in the cycles and in the cooling/heating questions. Energy balances are conducted around a piece of equipment and around a fluid or multiple fluids. The following are examples of the key equations that govern the energy balance across certain pieces of equipment. These energy balances are discussed further in other sections.
Turbines, Pumps and Compressors
Turbines, pumps and compressors change the amount of energy of the incoming fluid by changing the flow rate and pressure of the fluid. Pumps and compressors increase the flow rate and/or pressure of the fluid, while turbines reduce the flow rate and decrease the pressure of the fluid. In a pump and compressor, energy is transferred from a power source to the fluid. In a turbine, energy is transferred from a fluid to provide a power source. In both cases, this power source is called Work. Essentially work is transferred to or from these pieces of equipment.
Boilers, Condensers and Evaporators
Boilers, condensers and evaporators are pieces of equipment where a phase change in a fluid occurs. In boilers and evaporators, liquid is changed to gas and in condensers, gas is changed to liquid. In boilers and evaporators, energy is added into the system by the boiler or evaporator in order to heat the liquid to gas. In condensers, heat is removed from the system by the condenser in order to change the gas to a liquid. The energy balance equations governing these pieces of equipment take into account the phase change of the fluids.
Nozzles and Diffusers
Nozzles and diffusers are used to change the velocity of a fluid through the use of a change in pressure. So the fluid’s velocity and pressure will be different but the energy entering the nozzle or diffuser and leaving the nozzle or diffuser will be the same. This is assuming that there is no elevation change, no heat loss, no friction loss and no work done by the fluid.
Heat Exchangers
Heat exchangers are used to transfer heat from one fluid the other. Heat exchangers can be used to transfer heat from one hot liquid to a cold liquid, a hot air stream to a cold air stream, from air to liquid or from liquid to air. Since there is no phase change, the energy balance equation is only based on the mass flow rate of both fluids, the temperatures of these fluids and the heat capacity of both fluids.
Mixing
In feedwater heaters or in tanks, two fluids may be mixed together. The energy balance on these types of systems involves calculating the total energy of the fluids entering the system, which will equal the energy of the mixed fluid. A few equations shown below highlight this relationship. This mixing energy balance can be applied to both air and liquid. Similarly to boilers, condensers and evaporators, if a phase change occurs, then the energy change due to the phase change must be taken into account.
4.0 Laws of Thermodynamics
This section is covered in the technical study guide.
5.0 Thermodynamic Processes
There are two main thermodynamic cycles that are a critical part of the PE exam and play an important role in the Thermodynamics & Fluids field of practice. These two cycles are the Brayton and the Rankine cycles. If you can understand these two cycles completely, then you should put yourself in a good position to pass the PE exam. This section will describe the principles that govern these cycles and will also introduce the diagrams that are used in these cycles.
Pressure-Enthalpy Diagrams
The pressure-enthalpy (P-H) diagram describes the liquid, vapor and mix region of a fluid and in this case water. As shown in the following figure, the P-H diagram consists of pressure (psia) on the y-axis and enthalpy (Btu/lbm) on the x-axis. It is important to note that pressure is shown on a logarithmic scale while enthalpy is shown in a normal scale. In the middle of the diagram is the vapor dome. This dome separates the sub-cooled liquid (aka water) on the left side, super-heated vapor (aka steam) on the right side and the liquid-vapor mix region (aka mixed region or wet region) in the middle.
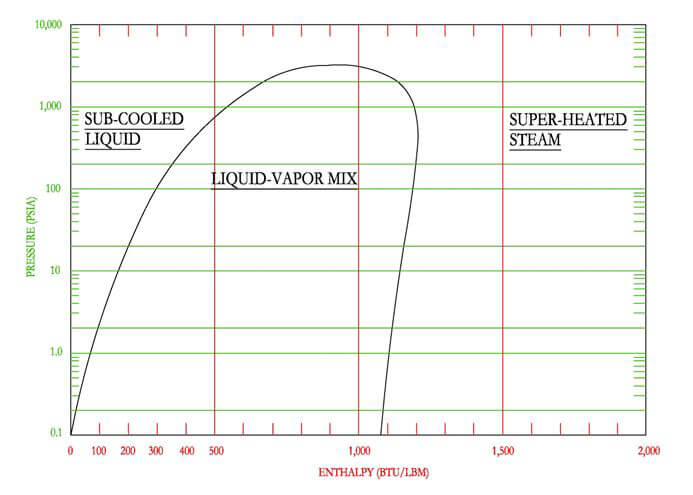
The mixed region is cut by upward sloping lines that represent the percentage of vapor, as shown in the following figure. The figure shows that as you move from left to right on a constant pressure line, the percentage of vapor increases from 0% at the saturated liquid to 100% at the saturated vapor line. The percentage of vapor is also known in other terms as steam quality and dryness fraction, where saturated vapor has a steam quality or dryness fraction of 1.
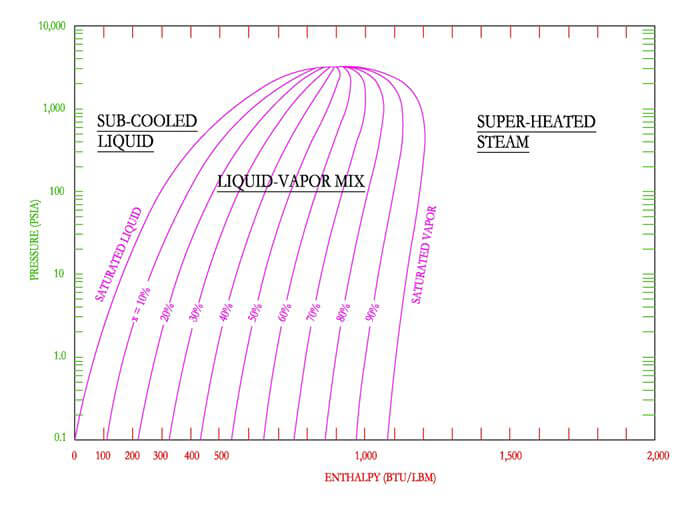
See technical study guide for continuation on Pressure-Enthalpy diagrams.
Thermodynamic Tables
There are three main types of thermodynamic tables that the engineer must be able to use the, (1) Saturation Tables as a function of pressure; (2) Saturation Tables as a function of temperature and (3) Superheated Tables. From this point on, Steam shall be used as an example of a Thermodynamic table. But water/steam can be substituted for other liquids and the skills you learn here can be applied to other liquids.
Graphically the steam tables show the values of the outer dome on the pressure-enthalpy diagram. The following figure shows the points that are selected for the steam tables. This figure shows the values as a function of pressure.
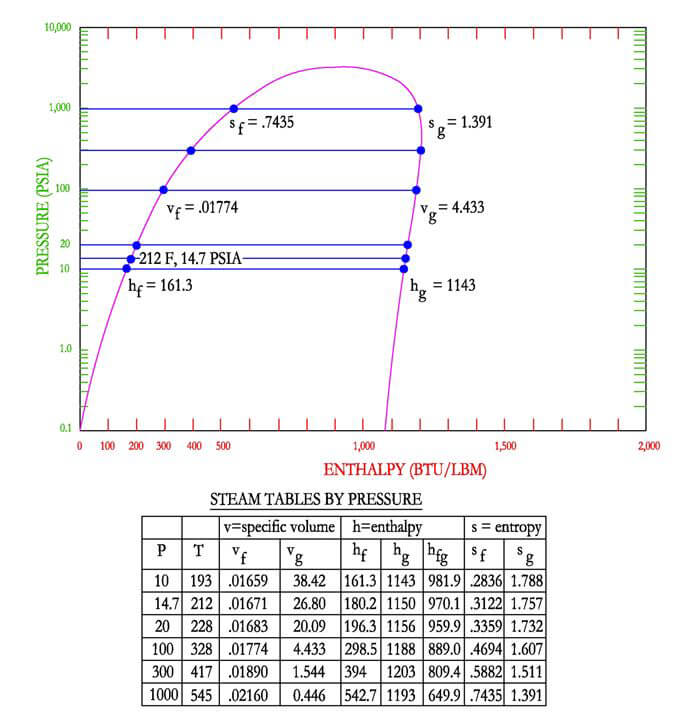
See technical study guide for a continued discussion on Thermodynamic Tables.
Enthalpy-Entropy Diagrams
Enthalpy-entropy diagram shows graphically the various properties of fluids ranging from superheated region to the mixed region. The diagram does not provide water (liquid) properties. The following diagram and discussion shall focus on water/steam. A sample of the diagram is shown below in order to illustrate the main points of the diagram and how to use the diagram. The aspiring professional engineer should refer to the actual tables located in the Schaum’s Thermodynamics for Engineers or the Mechanical Engineering Reference Manual.
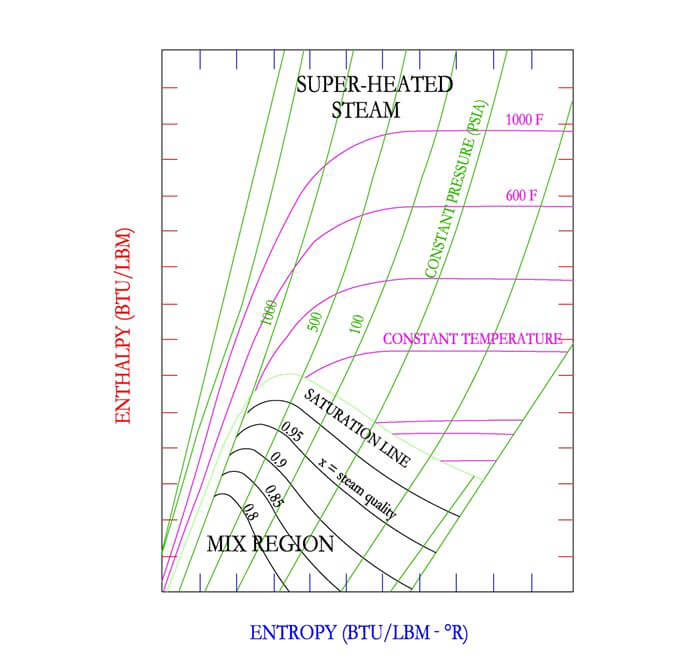
First, inspect the axes, note that the y-axis indicates enthalpy and the x-axis indicates entropy. The Mollier diagram shows only two regions, the mixed region of vapor and liquid and the super-heated vapor steam region. The two regions are separated by the downward sloping saturation line, where steam quality is equal to 1. Secondly, notice the upward sloping (left to right) constant pressure lines. Constant dryness fraction or steam quality lines are shown as downward sloping in the mix region. Finally, the diagram has slightly downward sloping constant temperature lines, which is only applicable in the super heat region.
Finding Thermodynamic Properties
One of the main skills that the aspiring professional engineer must acquire is the ability to determine the thermodynamic properties of fluids and in this case steam. In practice, the pressure and temperature of steam can be measured via pressure gauges and temperature gauges. However, the other useful properties of steam like entropy, enthalpy and specific volume must be found through the use of the (1) P-H Diagram, (2) Enthalpy-Entropy Diagram and (3) Thermodynamic Properties Tables.
A simple way to find the properties of steam given the temperature and pressure is to draw a simple P-H diagram. For example, assume water is at 14.7 psia and 60 F. Next draw a simple P-H diagram. It is known that at 14.7 PSIA (1 ATM), the boiling point is 212 F, thus the constant temperature line in blue can be drawn. Since the temperature of the water is 60 F, then the point must be located to the left along the horizontal constant pressure line. Note that since constant temperature lines are vertical in the sub-cooled liquid region, that the enthalpy of water at 14.7 PSIA, 60 F is equal to the enthalpy of saturated liquid water at 60 F. Take vertical line down from 14.7 PSIA, 60 F to the intersection of the saturated liquid curve.
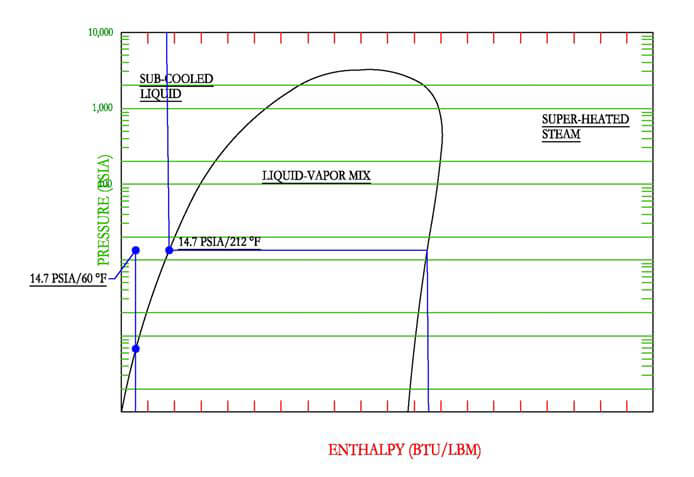
See technical study guide for more information on how to find thermodynamic properties.
Thermodynamic Transitions
Thermodynamic transitions describe various movements a fluid may take in a thermodynamic cycle. These are the individual steps that will make a complete thermodynamic cycle. For example, a thermodynamic transition may be a fluid compressed from pressure state 1 to pressure state 2 or a fluid expanded from pressure state 3 to pressure state 4. The way the fluid moves from one state to the next will also provide more information on the thermodynamic properties of the fluid. For example, one of these transitions may occur isentropically (no change in entropy) or isothermally (no change in temperature). As an engineer you should understand each of these transitions and what equations can be used to find thermodynamic properties of fluids as the fluids go through the thermodynamic cycles.
- Isentropic Transition from Pressure State 1 to 2:
- Isobaric Transition with Heat Gain or Heat Rejection:
- Adiabatic: No change in energy
- Isothermal: No change in temperature
- Icochoric: No change in volume
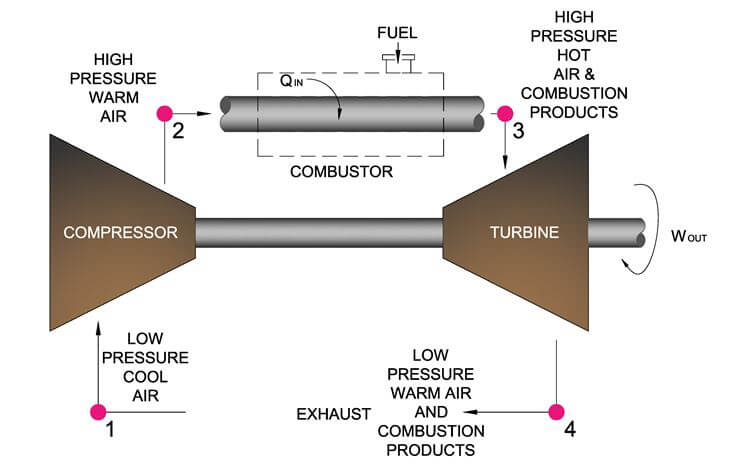
Ideal Open Gas Turbine Cycle
The two major application areas of the open gas turbine cycle are for aircrafts and electric power generation. In an open cycle the working fluid (air) only passes through the cycle once and is then exhausted to the atmosphere. In a closed cycle, the working fluid (air) is recycled through the cycle. One assumption that you should be aware of is that the mass flow rate through both the open and closed cycles are assumed to be constant. Although fuel does enter the cycle, it is assumed that the only mass flow rate to be considered in doing problems is the mass flow rate of the air. This is typically a safe assumption because the ratio of air to fuel is quite large, typically fuel can be around 2% of the total mass flow rate.
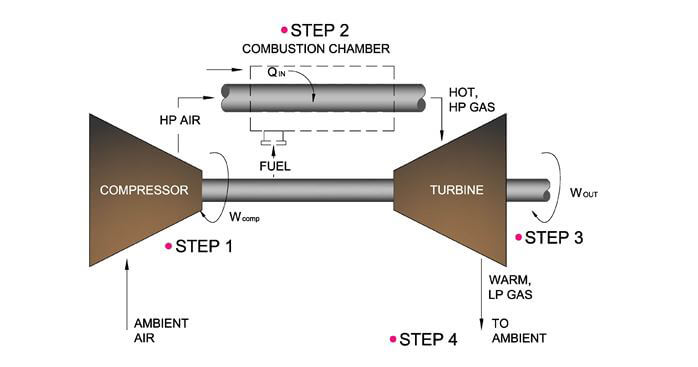
The above figure shows the components of an open Brayton cycle. Step 1 to 2 is the isentropic compressor. Step 2 to 3 is a constant pressure combustion chamber. Step 3 to 4 is the isentropic turbine.
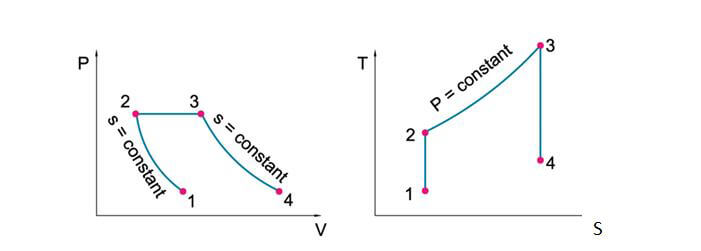
These figures show the constant entropy and constant pressure paths in the Brayton cycle. Use these figures with the previous figure to match each point to each piece of equipment. See technical study guide for more detail on the Ideal Brayton Cycle.
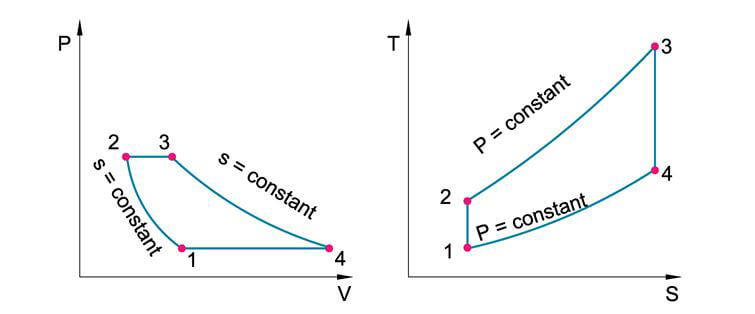
Ideal Brayton Cycle - Closed Gas Turbine Cycle
The Brayton cycle or closed gas turbine cycle is similar to the open gas turbine cycle, except the air is not exhausted to the atmosphere. In order to accomplish this, heat exchangers are placed at the combustion chamber section and at the exhaust section.
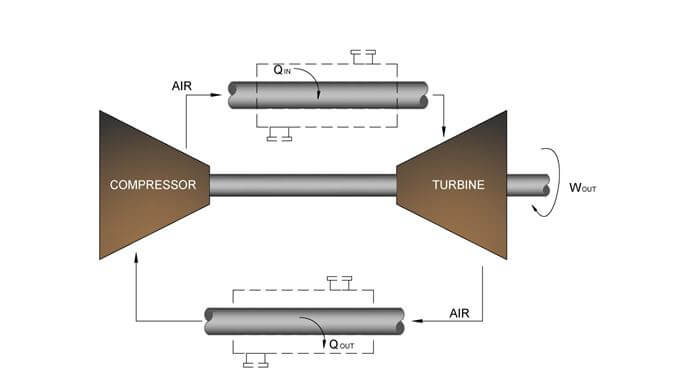
The above figure shows the components of a Brayton cycle. Step 1 to 2 is the isentropic compressor. Step 2 to 3 is a constant pressure heat exchanger. Step 3 to 4 is the isentropic turbine and Step 4 to 1 is a constant pressure heat exchanger.
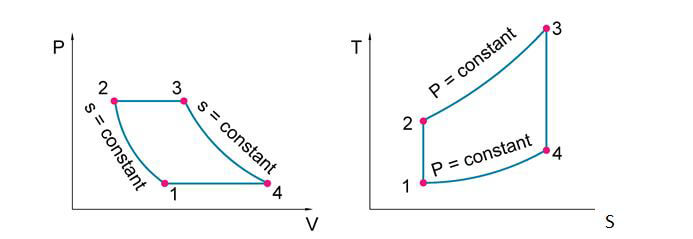
This figures show the constant entropy and constant pressure paths in the Brayton cycle. Use this figure with the previous figure to match each point to each piece of equipment.
See technical study guide for more detail on the Ideal Brayton Cycle.
Actual Brayton Cycle - Closed Gas Turbine Cycle
The actual Brayton cycle is a little different from the ideal Brayton cycle, because processes do not occur isentropically in reality, meaning that entropy is added. Also excess heat or less heat can be added during the steps.
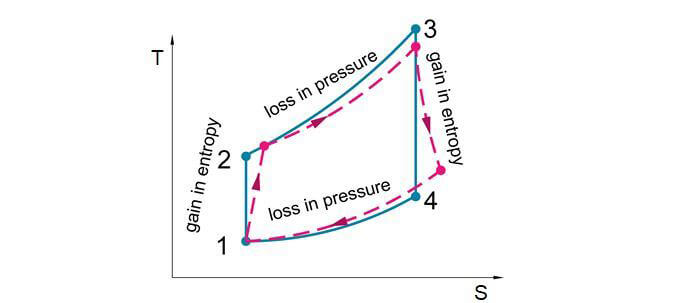
See technical study guide for more detail on the Actual Brayton Cycle.
Rankine Cycle
Steam power plants run vapor power cycles with water as the working fluid. This section introduces the ideal cycle for vapor power cycle, the Rankine cycle. These steam powered plants generate electrical power by taking the heat from combusting coal, oil, biofuel or natural gas. The power plant consists of multiple systems working together. An overall view of all systems together is shown below.
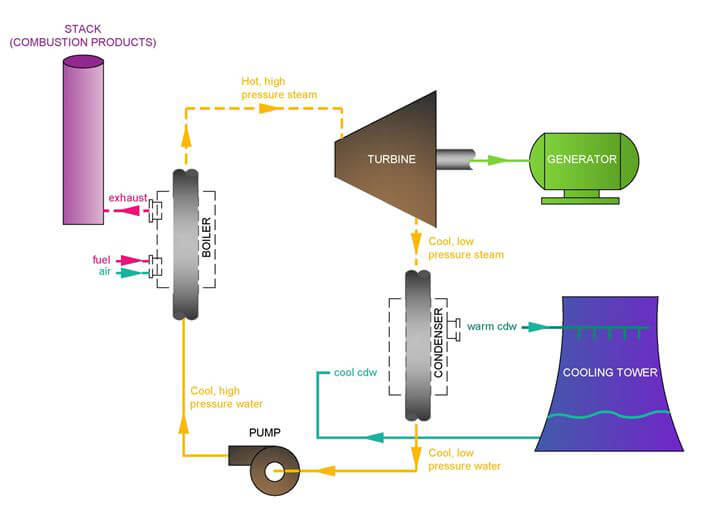
The thermodynamic cycle described by the yellow lines is called the Rankine cycle. This system consists of a boiler, turbine, condenser and a pump. Fuel, burned in the boiler, heats the water to generate superheated steam. The Rankine system is discussed in this section.
6.0 Performance of Components
This section is covered in the technical study guide.
7.0 Power Cycles
Brayton Cycle with Regeneration
As a starting point, you should be familiar with the Brayton cycle without regeneration. Although this is covered in the Thermodynamics section, the Brayton cycle is also provided here for ease.
The basic Brayton cycle can be either open or closed. The figure below shows an open cycle. In an open cycle the low pressure warm air and combustion products are exhausted to the atmosphere. Fuel enters the combustor and travels with the air. In a closed cycle, the air is kept within a closed system and only heat is transferred from the combustor to the air. The combustion products are kept separate from the air.
The basic Brayton cycle starts with low pressure cool air entering a compressor. Work is provided to the compressor, which produces high pressure warm air. Then this air enters the combustor, where it gains heat and increases in temperature. Finally, the high pressure, hot air, enters a turbine where it produces work. Some of this work is used to drive the compressor and the remaining is provided as useful work. The low pressure warm air is then exhausted to the atmosphere.
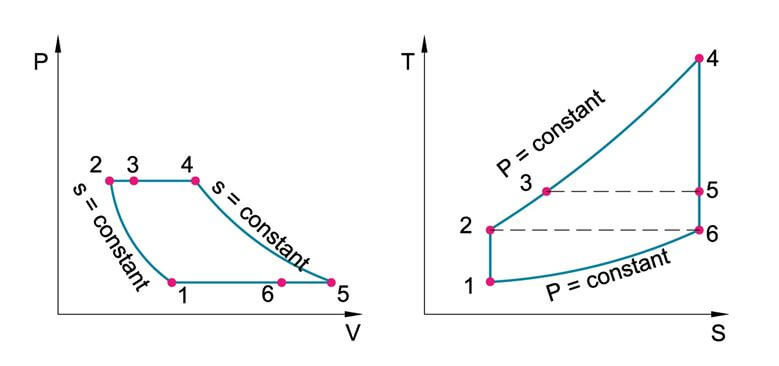
Each step of the basic Brayton cycle is governed by a thermodynamic transition. In the ideal Brayton cycle, the compressor and turbine are isentropic. The combustor is assumed to occur at a constant pressure or isobaric. The following figure describes each of these transitions graphically.
- Step 1 to 2: Compressor - The compression process is isentropic, meaning that there is no change in entropy.
- Step 2 to 3: Combustion chamber and heat exchanger - Heat is transferred from combustion to the air.
- Step 3 to 4: Turbine - This hot pressurized air then enters the turbine and as the gas expands (loses pressure and energy). The energy is converted to work to turn the turbine. Following the turbine, an electric generator is turned to produce electricity. Some of the work is used to power the compressor.
- Step 4 to 1: Exhaust - The warm, low pressure air is then exhausted to the atmosphere.


The Brayton cycle with regeneration uses the waste heat from the warm, low pressure air to pre-heat the air before it enters the combustor. As you can see in the figure below, the air leaves the turbine at point 5 and instead of being exhausted; the air enters a regenerative heat exchanger. At the heat exchanger the warm air transfers heat to the entering air.
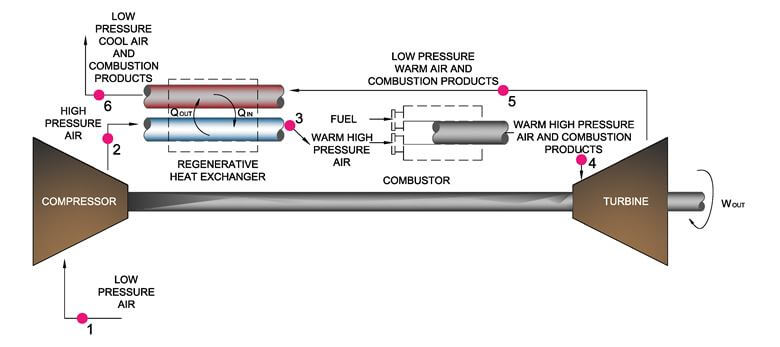
At point 1, air enters the compressor and the air increases in pressure and temperature to point 2, while the entropy is constant. This is based on the assumption that the compressor is isentropic.
Next, the air enters the regenerative heat exchanger and the air increases slightly in temperature to point 3. This process is assumed to be isobaric, so the pressure does not change. The majority of the heat input and increase in temperature occurs at the combustor, which increases the temperature from point 3 to point 4.
At point 4, air enters the turbine at a high pressure and temperature and then the air leaves at a low pressure and temperature at point 5. The energy loss is transferred to work at the turbine. The work is used to drive the compressor and also to useful work.
The low pressure, warm air then transfers its heat to the incoming air at the regenerative heat exchanger. The air then leaves the regenerative heat exchanger at a lower temperature at point 6. If the regenerative heat exchanger was perfect, then the temperature at point 6 would equal the temperature at point 2. Also the temperature at point 3 would equal the temperature at point 5.
The book also includes similar information as above on the following combination cycles, (2) Brayton Cycle with Intercooling, (3) Rankine Cycle with Reheat and (4) Rankine Cycle with Regeneration. See the technical study guide to get more information.
8.0 Refrigeration Cycles
The vapor compression cycle is the primary cycle used in commercial refrigeration systems.
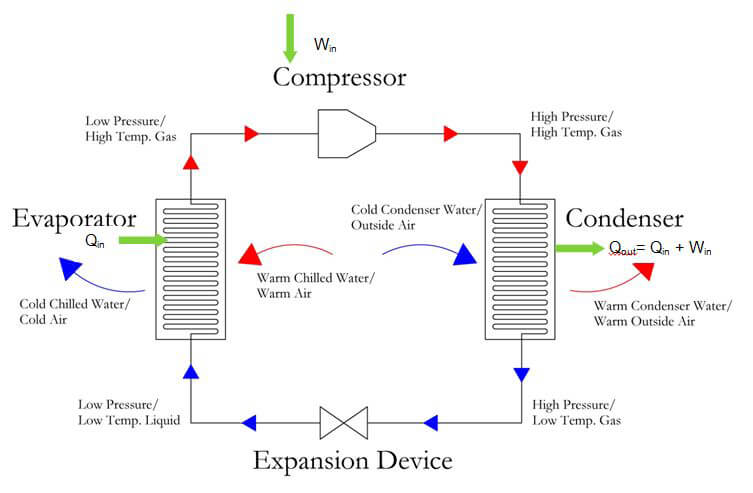
The vapor compression cycle starts at (Step 1) the evaporator, with cold, low-pressure, liquid refrigerant. It absorbs heat and evaporates to a low-pressure gas. Then the gas is (Step 2) Compressed to a high-pressure, high-temperature gas and (Step 3) condensed to a high pressure, low temperature liquid. Finally, the gas is expanded (reduced in pressure) at the (Step 4) expansion device to a cold, low-pressure liquid refrigerant.
See technical study guide for more detail on the vapor compression cycle including detailed information on each step, evaporator, compressor, condenser and expansion valve. In addition a second explanation is provided in terms of the P-H diagram.
9.0 Non-Reacting Mixtures of Gases
This section is covered in the technical study guide.
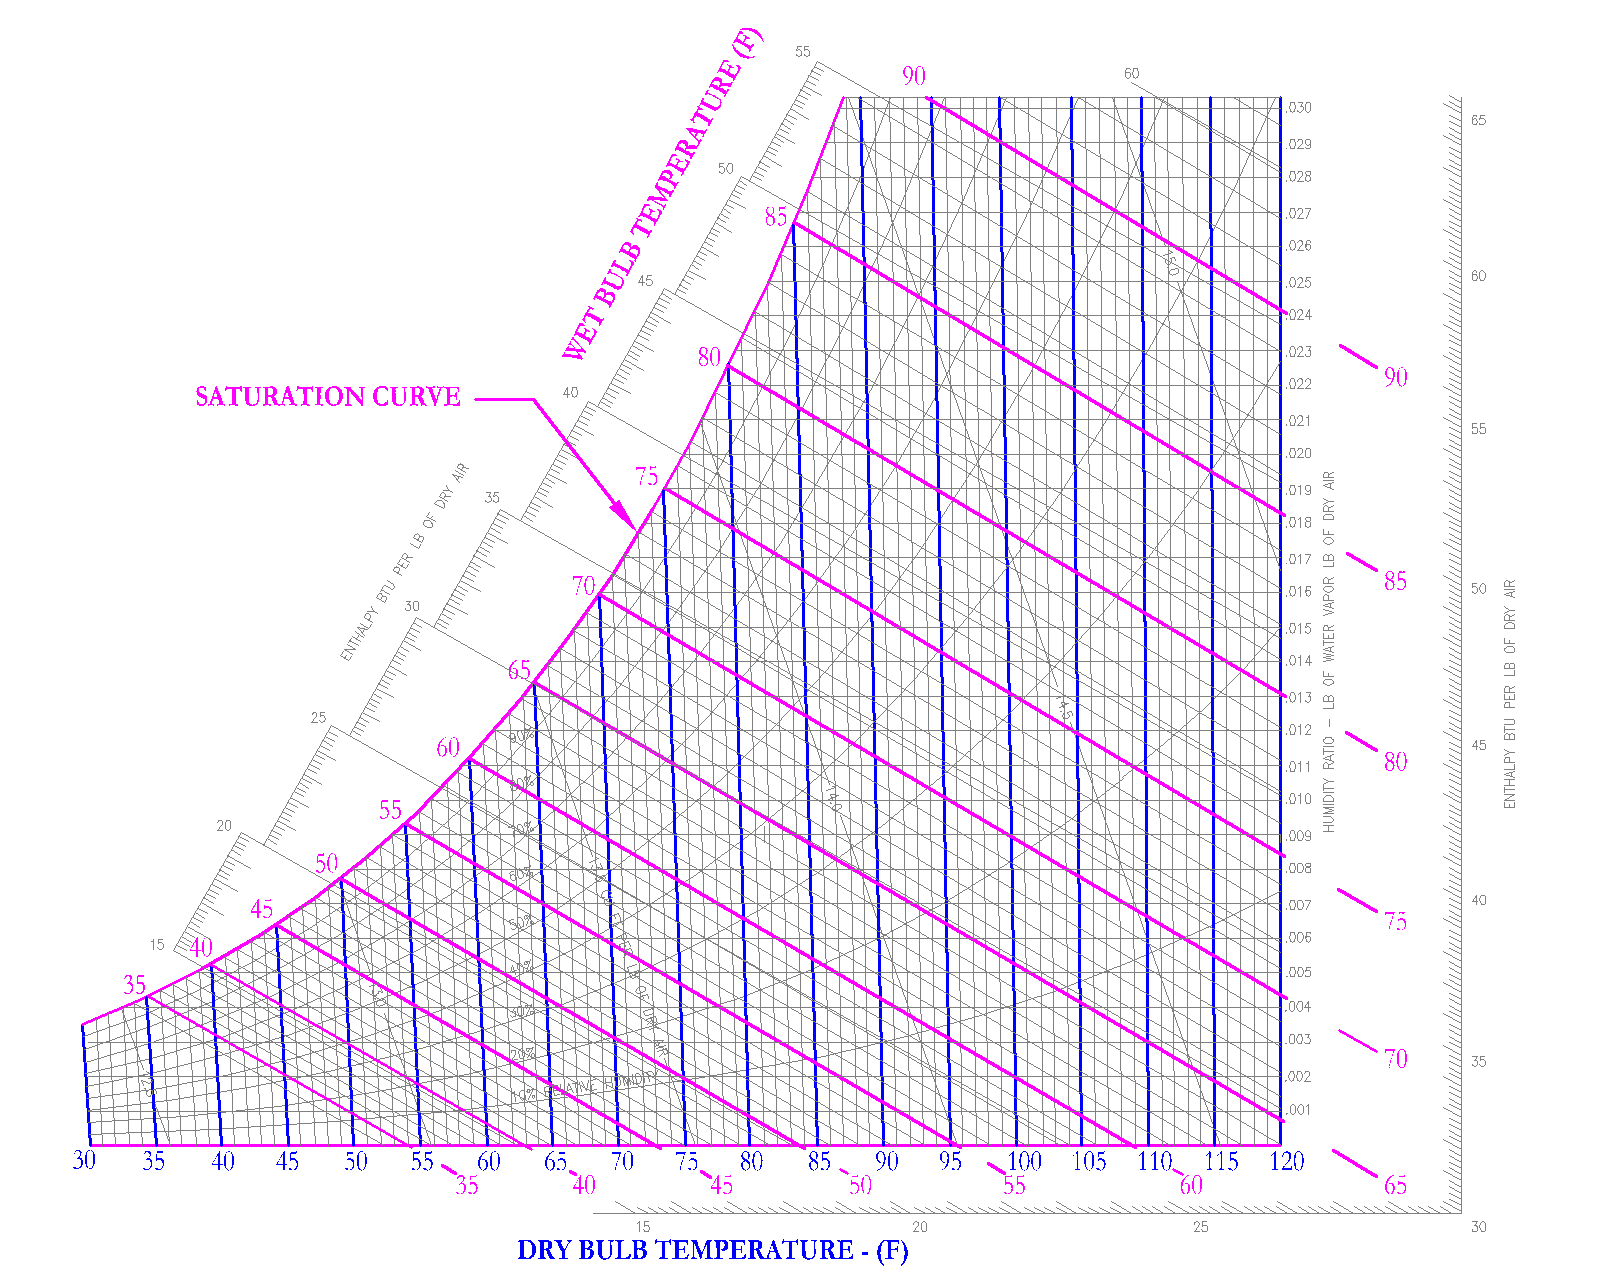
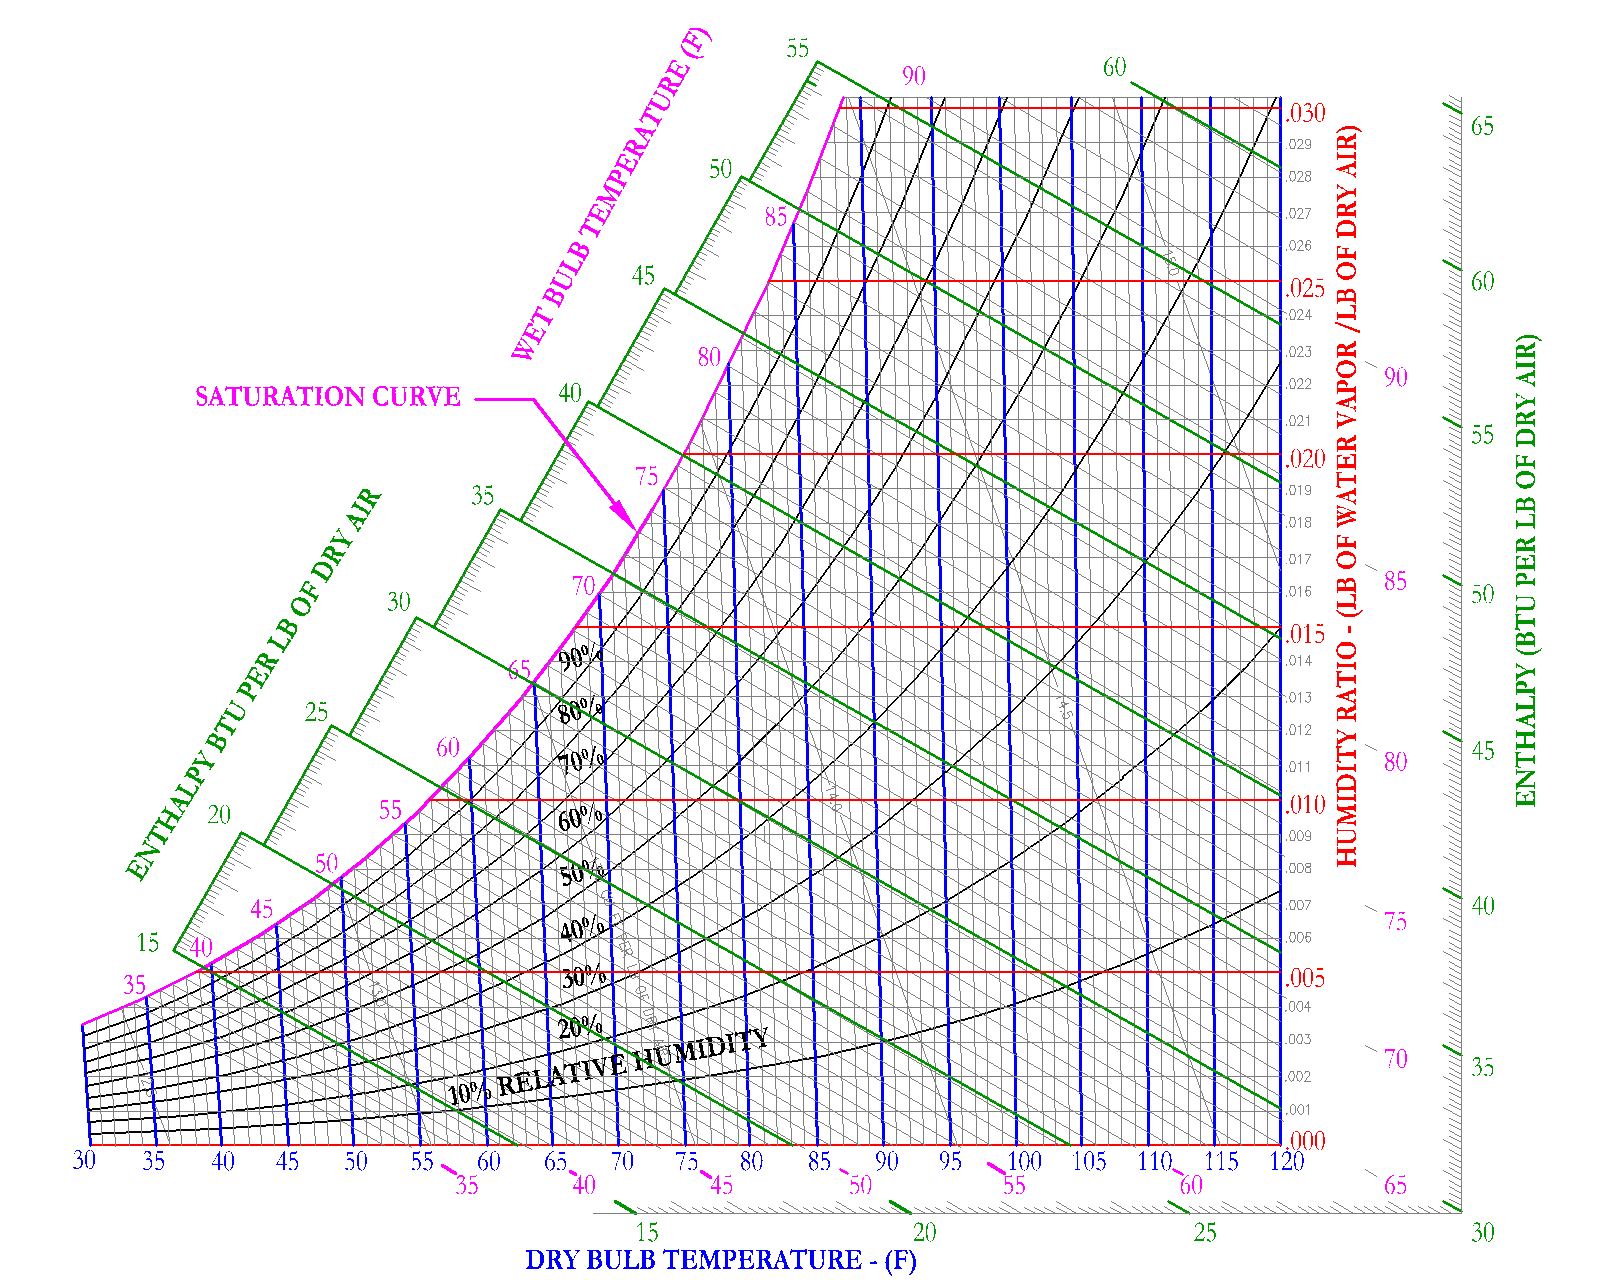
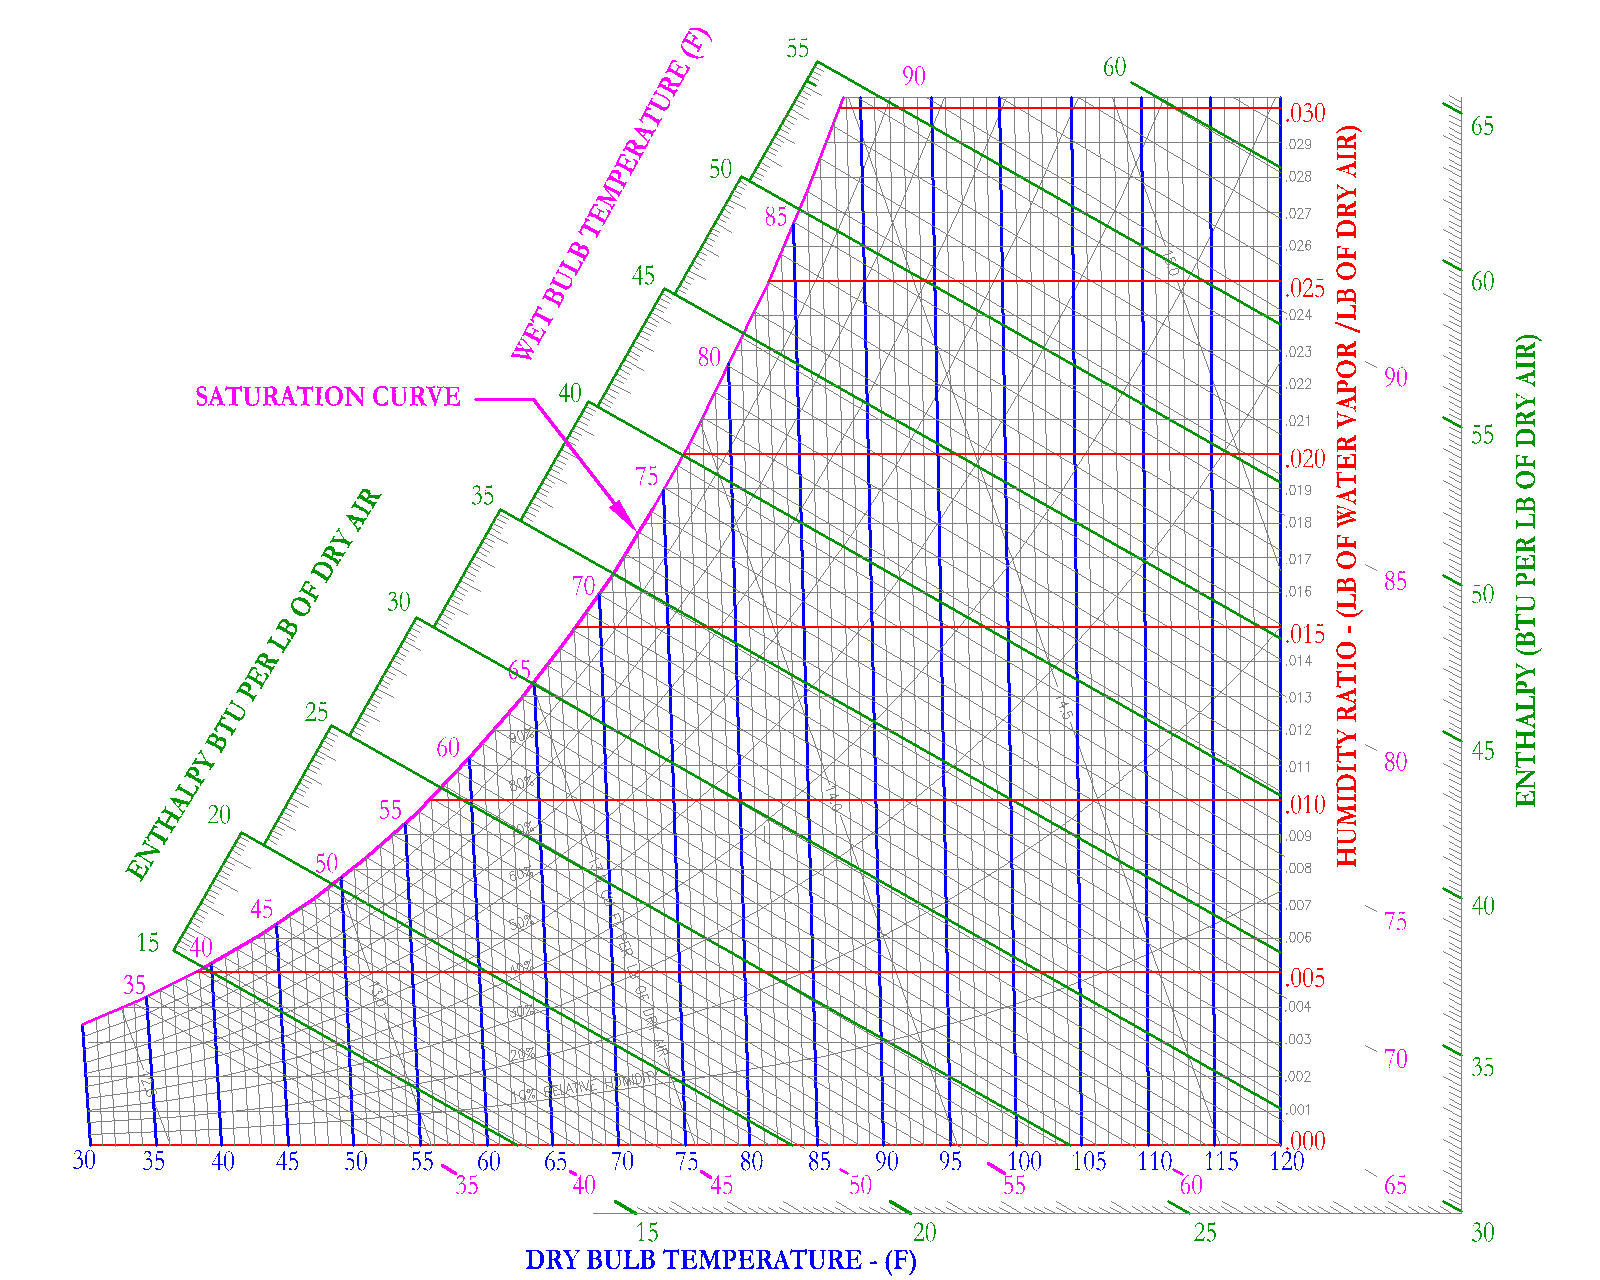
10.0 Psychrometrics
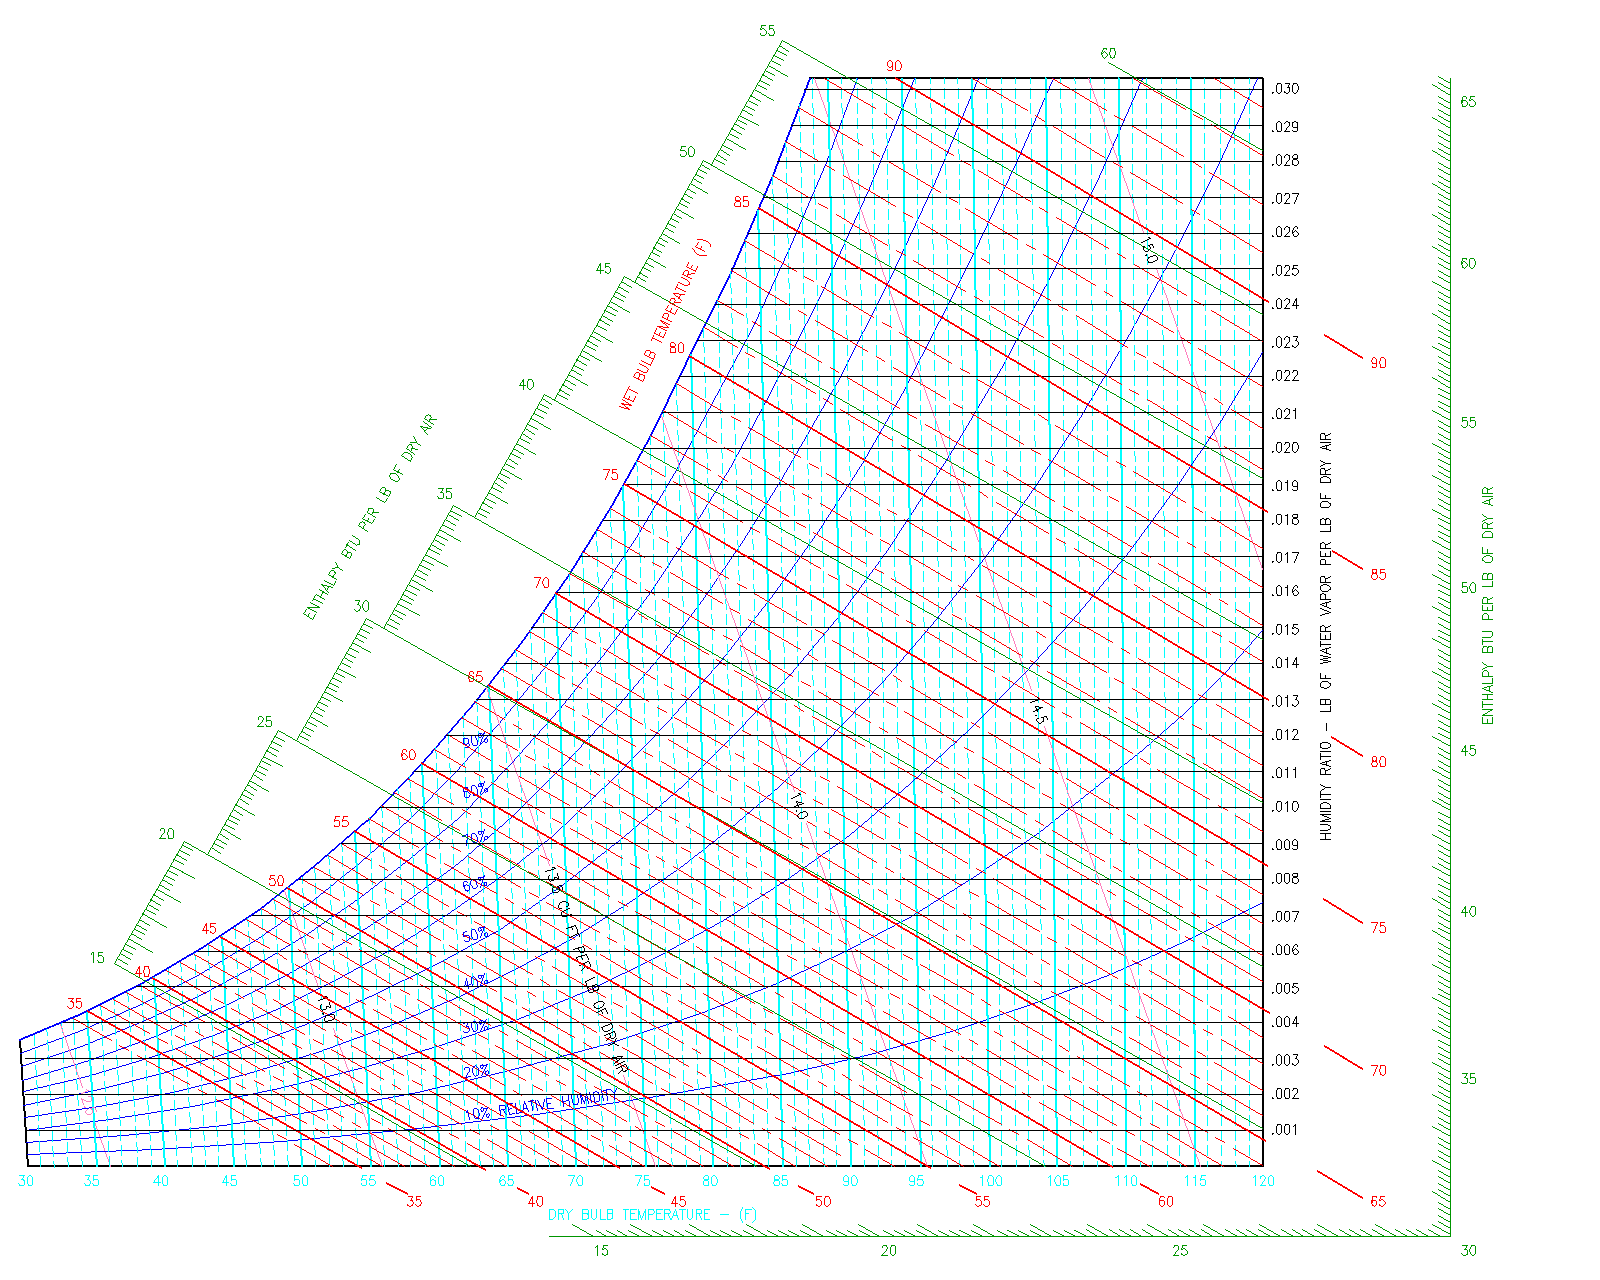
Psychrometric Chart
The Psychrometric Chart describes the various properties (Dry Bulb Temperature, Wet Bulb Temperature, Enthalpy, Humidity Ratio, Relative Humidity and Specific Volume) of moist air. Moist air is defined as an air-water mixture. Moist air on a psychrometric chart ranges from Dry Air to Saturated Air.
The psychrometric char does not account for variations in pressure. As you can see, pressure is not shown on any axes, because it is constant. For the PE exam and for this guide, it is assumed that the psychrometric chart is based on atmospheric pressure (14.696 psia or 1 atm or 29.921 in. Hg). The psychrometric chart for the PE exam also only shows the typical temperatures encountered by a typical HVAC and Refrigeration Engineer.
Now that you understand the basics of a psychrometric chart, we will now go into detail on the following (3) Pscyhrometric Chart Topics:
Now that you understand the basics of a psychrometric chart, we will now go into detail on the following (3) Pscyhrometric Chart Topics:
- Air Properties on the Psychrometric Chart: What does each property tell of the air-water mixture?
- Movement on the Psychrometric Chart: What causes each type of movement on the chart (Right to Left, Up and Down)
- Typical Psychrometric Questions: Mixtures of Moist Air, Humidification/Dehumidification, Heating/Cooling Questions
Psychrometric Chart - Properties
The psychrometric chart as previously discussed, graphically shows the theromdynamic properties of Moist Air (air-water mixture, humid air, etc.).
- Dry Bulb Temperature:This is the temperature most people are familiar with, as they are always shown on thermometers and thermostats. It is called dry because the temperature is not affected by the moisture in the air.
- Wet Bulb Temperature: This temperature takes into account the moisture in the air. A wet bulb temperature that is equal to the dry bulb temperature, indicates saturated air. A wet bulb temperature much lower than the dry bulb temperature is an indication of dry air.
- Relative Humidity: Relative humidity is the ratio of the amount of water vapor in the air mixture - compared to the maximum amount of water vapor the air can hold at that dry bulb temperature. For example, an air mixture at 100% relative humidity is shown on the saturation curve because the amount of water vapor in the air mixture is equal to the maximum amount. Dry air is shown as the x-axis, which has a relative humidity of 0%, since there is no water vapor in the air mixture.
- Humidity Ratio: This property describes the amount of water content in the air, expressed as the water vapor per unit weight of dry air[lbm of water vapor/lbm or air] or [kg of water vapor/kg of air]. Sometimes the humidity ratio is expressed as grains of water vapor per 1 lbs of dry air. Symbol = [W].
- Enthalpy:The amount of energy in moist air [Btu/lb of dry air]. Symbol = [h]
- Specific Volume:The cubic feet of the mixture per pound of dry air.[ft^3/lb]
There are also a couple of implicit properties that are shown on the psychrometric chart, including the dew point, which can be found by first finding the point on the graph and moving horizontally to the saturation curve./
Dry Bulb
This is the temperature most people are familiar with, since the Dry Bulb temperature is the temperature always shown on thermometers and thermostats. It is called dry because the temperature is not affected by the moisture in the air. It is a direct indication of the amount of sensible heat in the air at the given conditions.
In practice, design dry bulb temperatures for typical offices range from 72 to 75 F. Also typical dry bulb temperatures of cool supply air from an air handling coil ranges from 52 to 55 F. For the purpose of the PE Exam, United States Customary Units or USCS are used. Please do not spend additional time on studying conversions to International System of Units (SI).
On the psychrometric chart, the dry bulb temperature is shown by vertical, parallel lines, below in blue.
Wet Bulb Temperature
This property takes into account the moisture in the air. The wet bulb temperature in conjunction with the dry bulb temperature is a direct indication of the amount of moisture in the air.
The wet bulb temperature is measured through the use of a sling psychrometer, which consists of a thermometer covered by a wetted cloth wick. The psychrometer is swung and if the air is dry, then the wetted cloth wick will begin to evaporate. The energy lost to evaporation cools the wetted cloth wick, which will in turn decrease the temperature reading.
If the air is saturated, then the wetted cloth wick will not evaporate and the wetted cloth wick will read the same temperature as the air. The drier the air, the more evaporation will take place, which will cool the wetted cloth wick and will decrease the wet bulb temperature reading. Thus the difference between the dry bulb temperature and the wet bulb temperature describes whether or not the air is humid or dry.
For example, wet bulb temperatures significantly lower than the dry bulb temperature is an indication of dry air. A wet bulb temperature near the dry bulb temperature describes air that is nearly saturated.
On the psychrometric chart shown in the below figure, the wet bulb temperature lines originate from the intersection of the corresponding dry bulb temperature and the saturation curve. The wet bulb lines are shown in pink. If you follow the dry bulb lines shown in blue from the dry air line up to the saturation curve, you can see that the wet bulb increases until it equals the dry bulb temperature. When the wet bulb temperature equals the dry bulb temperature, then the air is saturated.
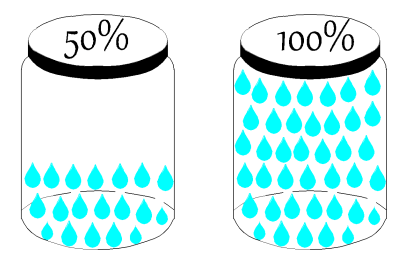
Relative Humidity
Relative humidity is the ratio of the amount of water vapor in the air mixture - compared to the maximum amount of water vapor the air can hold at that dry bulb temperature. For example, an air mixture at 100% relative humidity is shown on the saturation curve because the amount of water vapor in the air mixture is equal to the maximum amount. Dry air is shown as the x-axis, which has a relative humidity of 0%, since there is no water vapor in the air mixture.
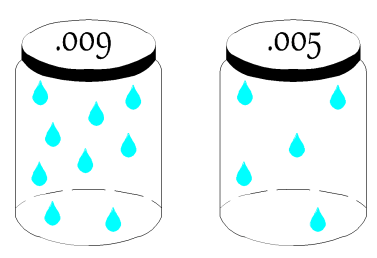
The figure below shows two equal volumes of air in a jar. One jar or volume of air contains the maximum amount of water it can hold, as illustrated as a completely filled jar of water vapor droplets. The other jar is showing only half the amount of water vapor droplets and therefore has a relative humidity of 50%.
Humidity Ratio
This property describes the amount of water content in the air, expressed as the water vapor per unit weight of dry air [(lbm of water vapor)/(lbm of dry air)] or [(kg of water vapor)/(kg of dry air)]. Sometimes the humidity ratio is expressed as [(grains of water vapor)/(1 lb of dry air)], where the symbol of these units is [W]. Another term used for humidity ratio is absolute humidity.
Air with a humidity ratio of .009 [(lbm of water vapor)/(lbm of dry air)], as shown graphically by (9) water vapor droplets. The jar on the right, holding a volume of air, has a humidity ratio of .005 [(lbm of water vapor)/(lbm of dry air)], as illustrated by (5) water vapor droplets in the same volume of air. Mass can be interchanged with volume, if it is assumed that the density is constant. Thus, the jar with the larger number of droplets for the same volume of air has a higher humidity ratio.
Enthalpy
Enthalpy is the summation of the amount of sensible and latent energy in the air. [Btu/lb of dry air]. Enthalpy is represented by the symbol = [h]. In HVAC, enthalpy is used to determine the amount of energy that is in moist air. It is important to recognize that on the psychrometric chart, enthalpy is shown as downward sloping lines in green. These enthalpy lines are closely aligned (but not completely) to the downward sloping wet bulb lines. Enthalpy shall be covered more closely in the following sections. This section is meant to introduce the term and its role on the psychrometric chart to the reader.
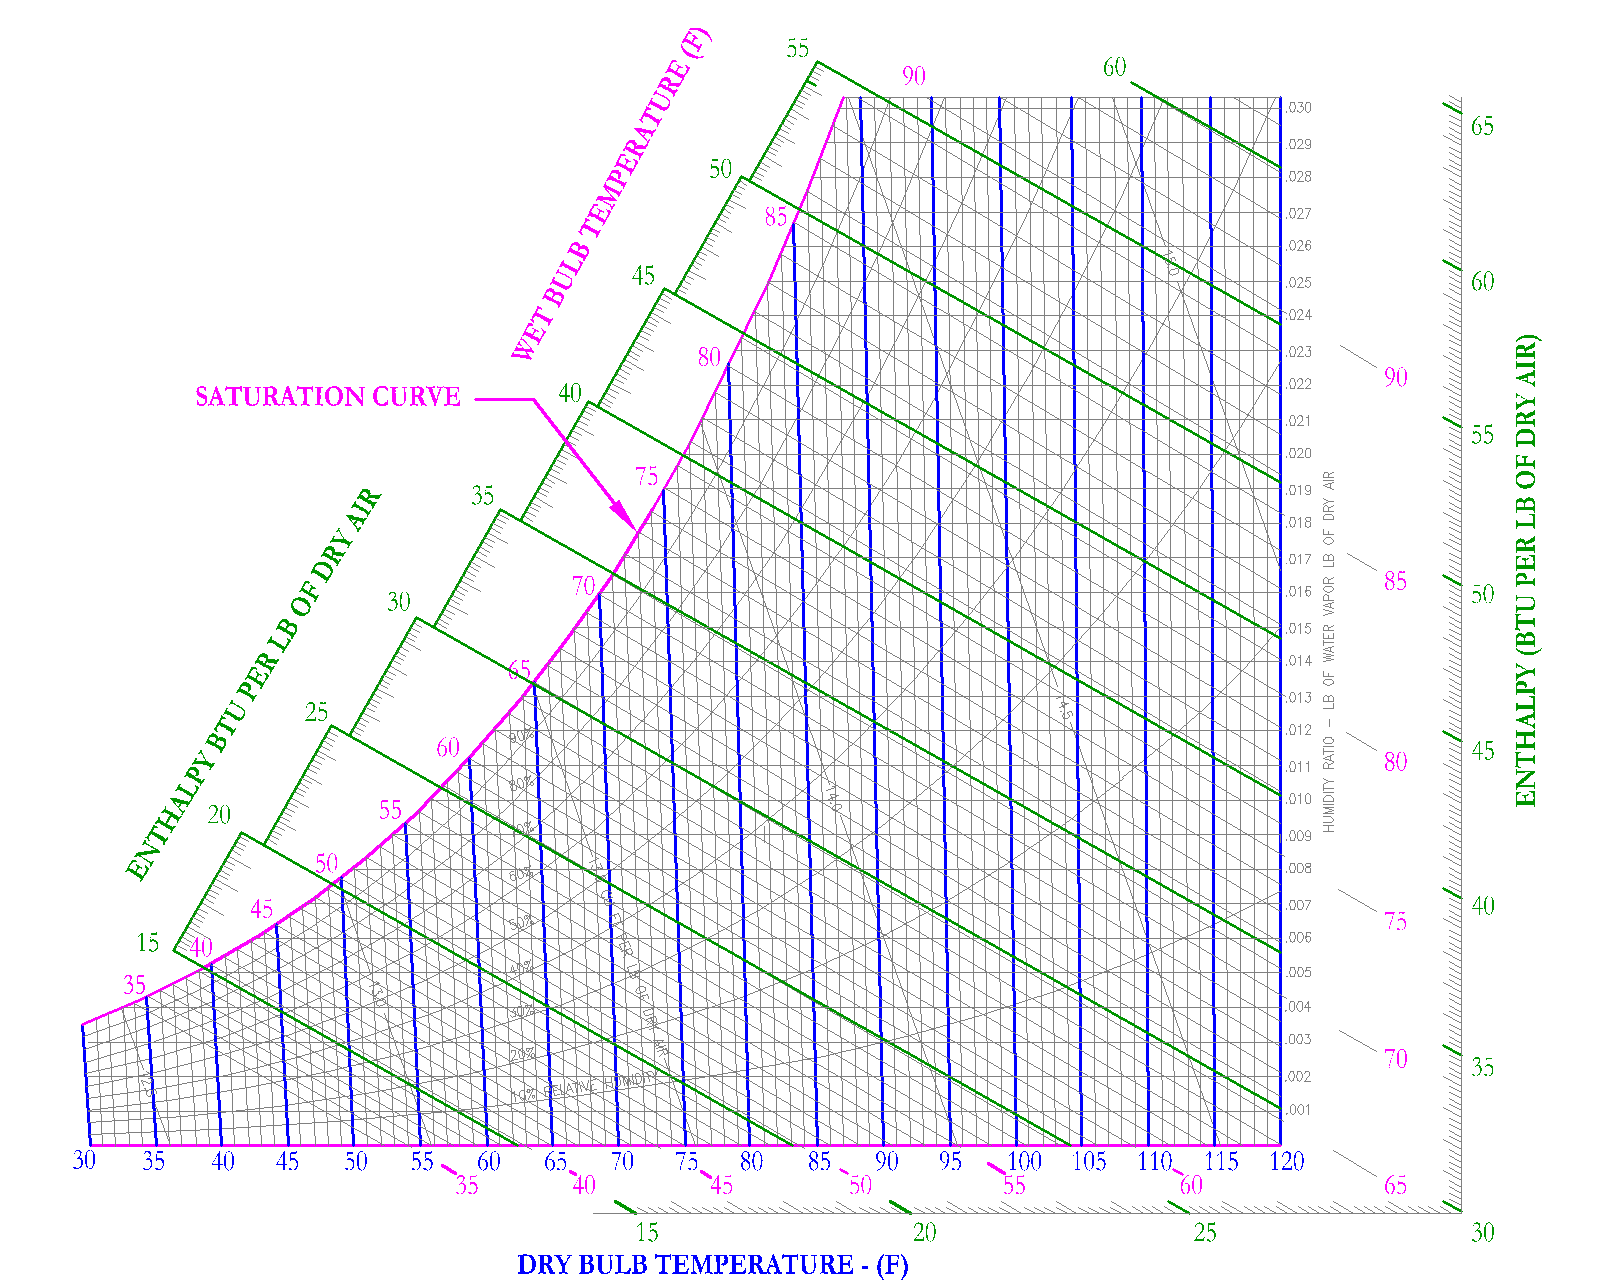
Specific Volume
Specific volume is used to define the volume taken up by moist air at specific conditions. The units are defined as [ft3/lb] and the symbol for specific volume is [v]. On the psychrometric chart, specific volume is shown as downward sloping lines, shown in red on Figure 10.
For example, air at 1 atmosphere, 68 F DB and 60 F WB would have a specific volume of 13.5 ft3/lb and air at 1 atmosphere, 88 F DB and 66 F WB would have a specific volume of 14.0 ft3/lb. It is important to note that specific volume lines are typically shown in 0.5 increments, it is up to the user of the Psychrometric Chart to extrapolate or interpolate to get more accurate specific volume measurements.
Most often air at 60 DB/58WB is used as standard conditions, this results in a specific volume of 13.33 [ft3/lb]. Density is simply the inverse of specific volume. At standard conditions, the density of air is 1/13.33 [ft3/lb] or 0.075 [lb /ft3].
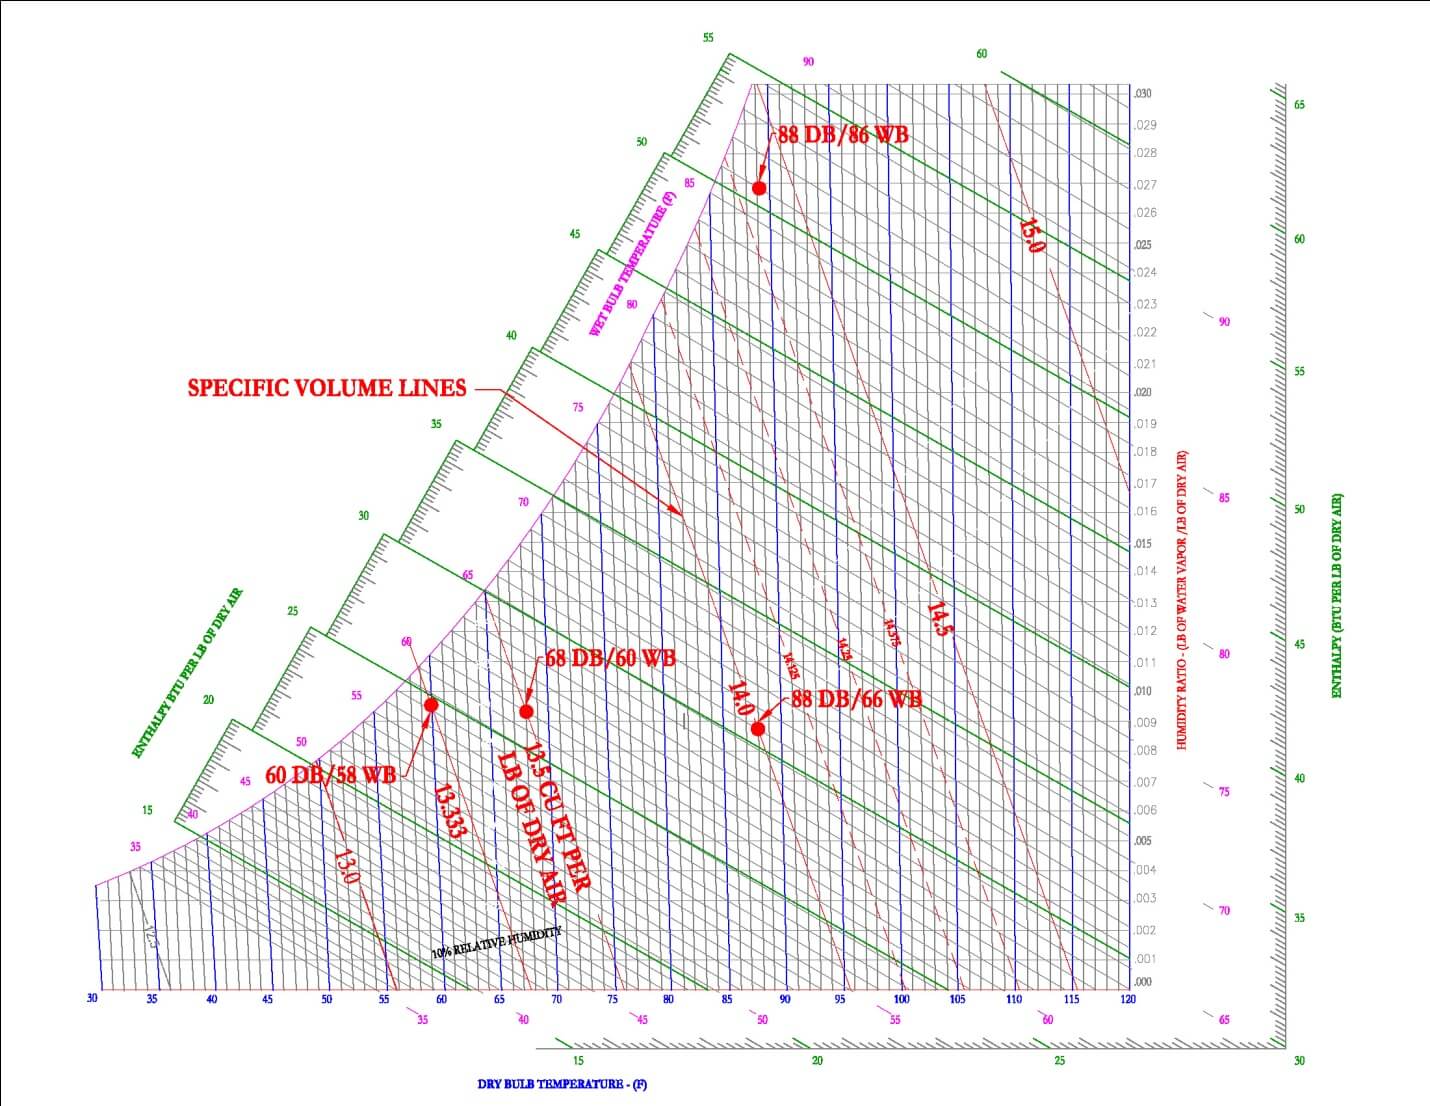
Dew Point
The dew point can be found by first finding a certain condition on the graph and moving horizontally left to the saturation curve. This is the temperature at which the air mixture must be cooled in order for condensation to first occur. In HVAC, this skill is often used to determine under what conditions condensation will occur on a window, pipe, duct or equipment surface. One example is the fairly new HVAC system called Chilled Beams. Chilled beams is the system of cooling spaces through the use of pipes containing cool water suspended below a ceiling, the pipes are often situated into a passive (no fan) or active (fan) heat exchanger. As warm air passes over the chilled beam, it cools and falls to the floor, thereby cooling the space below. Condensation is a concern because if the chilled beam is at a temperature below the dew point of the air, then as the air hits the coil, water may condense on the chilled beam and drip into the space.
11.0 HVAC Processes
Movement on Psychrometric Chart
Sensible Heating/Cooling
Sensible heating and cooling is defined as the removal or addition of heat to an air mixture, with no effect on the moisture content. Its sole effect is on the increase or decrease of the dry bulb temperature.
On a Psychrometric Chart, sensible heating and cooling is shown as a horizontal line. It is horizontal because the amount of water vapor in the air is not changed, thus the Humidity Ratio remains the same. A horizontal movement increases or decreases the dry bulb temperature. As the dry bulb temperature increases with sensible heating, the air's capacity to hold water also increases. The opposite is true with sensible cooling. In addition, sensible heating is shown on the graph below to decrease relative humidity, while sensible cooling increases relative humidity.
Latent Heating/Cooling
Latent heat energy is the amount of energy required to produce a phase change, water (liquid) to water (vapor).
Latent heating and cooling is defined as the removal or addition of moisture (water vapor) to an air mixture. Latent heating is more commonly known as humidification and latent cooling is known as dehumidification. In HVAC, common latent heat sources include people, equipment and outdoor air.
Sensible Heat Ratio
The sensible heat ratio (SHR) is used when there is diagonal movement on the psychrometric chart. Diagonal movement would indicate both sensible heating/cooling and latent heating/cooling. SHR is defined as the ratio of sensible heat to total heat.
Mixing of Two Airstreams
A common skill is determining the output conditions of the mixture of two air streams. The important concept to first understand is that the output conditions of the mixed airstream will be most similar to the air stream that has the most volumetric flow rate.
For example, if 2,000 CFM of 80 F DB/65 F WB is mixed with 100 CFM of 50 F DB/45 F WB, then the resulting mixed air conditions will be most similar to the 80 F DB/65 F WB air. This seems obvious but often times in test situations, the test taker may forget the obvious and simply rely on the calculations, which can be mistakenly entered into a calculator. This realization, will give the engineer an insight into the most probable answer of the four possible choices.
The second concept is that the dry bulb and humidity ratios change linearly. For example, if 2,000 CFM of 80 F DB is mixed with 2,000 CFM of 50 F DB, then the resulting temperature will be located equally in between 80 F DB and 50 F DB. The resulting temperature will be 65 F DB.
For example, if 3,000 CFM of 80 F DB is mixed with 1,000 CFM of 50 F DB, then the resulting temperature will be 72.5 F DB, corresponding to the location on the graph indicated by 75% of the total mixture is from 80 F DB air.
12.0 Combustion and Combustion Products
Most power plants are driven by a chemical reaction called combustion, which usually involves fuel sources that are compounds of hydrogen and carbon and an oxidizer (air). Combustion is the process by which the fuel is oxidized and as a result releases heat. The process also releases water and carbon dioxide.
The equation for combustion is as follows:

When you substitute the basic formula for a hydrocarbon fuel and air, then the resulting equation is as follows.
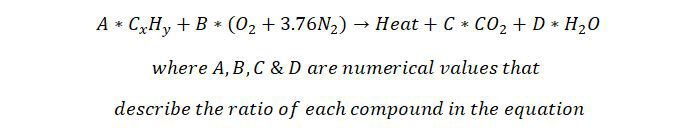
See technical study guide for more detail on combustion including fuel, air to fuel ratio, stoichometry and excess air.
13.0 Practice Exam Problems
13.1 PROBLEM 1 – EVAPORATOR
Background: A chiller uses R-134a refrigerant, with a flow rate of 50 lb/min and has a suction pressure of 40 PSIA and a discharge pressure of 200 PSIA, with no sub-cooling and no super heating.
Problem: What is the net refrigeration effect of the evaporator?
(a) 10 Tons
(b) 11.5 Tons
(c) 13.5 Tons
(d) 16 Tons
13.2 PROBLEM 2 – EVAPORATOR
Background: A chiller uses R-134a refrigerant, with a flow rate of 50 lb/min. The chiller is used to provide chilled water leaving the evaporator at a temperature of 45 F.
Problem: Which suction pressure should the evaporator operate at to provide a 10 degree F differential between the chilled water and refrigeration liquid temperature?
(a) 40 PSIA
(b) 45 PSIA
(c) 50 PSIA
(d) 55 PSIA
13.3 PROBLEM 3 – EVAPORATOR
This problem is covered in the practice exam, see the link below.
13.4 PROBLEM 4 – COMPRESSOR
This problem is covered in the practice exam, see the link below.
13.5 PROBLEM 5 – COMPRESSOR
This problem is covered in the practice exam, see the link below.
13.6 PROBLEM 6 – CONDENSER
This problem is covered in the practice exam, see the link below.
13.7 PROBLEM 7 – CONDENSER
This problem is covered in the practice exam, see the link below.
13.8 PROBLEM 8 – EXPANSION DEVICE
This problem is covered in the practice exam, see the link below.
13.9 PROBLEM 9 – EXPANSION DEVICE
This problem is covered in the practice exam, see the link below.
13.10 PROBLEM 10 – COP
Background: A chiller with a R-134a. The chiller operates with a suction pressure of 40 PSIA and a discharge pressure of 200 PSIA. The chiller is rated at 100 tons of useful cooling. The compressor also provides 84 KW of useful work to the system.
Problem: What is the COP?
(a) 3.5
(b) 4
(c) 4.2
(d) 4.6
13.11 PROBLEM 11 – COP
This problem is covered in the practice exam, see the link below.
13.12 PRACTICE PROBLEM 12: STEAM PRODUCTION
This problem is covered in the practice exam, see the link below.
13.13 PRACTICE PROBLEM 13: STEAM AIR COILS
This problem is covered in the practice exam, see the link below.
13.14 PRACTICE PROBLEM 14: STEAM - HOT WATER COILS
This problem is covered in the practice exam, see the link below.
13.15 PROBLEM 15 – BRAYTON CYCLE
Background: Air is compressed at a gas turbine from 14.7 psi and 77 degrees F to 73.5 psi. The resulting temperature is most nearly? Assume isentropic compression
.(a) 390 F
(b) 420 F
(c) 500 F
(d) 560 F
13.16 PROBLEM 16 – BRAYTON CYCLE
This problem is covered in the practice exam, see the link below.
13.17 PROBLEM 17 – COMBUSTION
This problem is covered in the practice exam, see the link below.
13.18 PROBLEM 18 – RANKINE CYCLE
This problem is covered in the practice exam, see the link below.
13.19 PROBLEM 19 – PSYCHROMETRICS CHART
This problem is covered in the practice exam, see the link below.
13.20 PROBLEM 20 – AIR MIXTURES
This problem is covered in the practice exam, see the link below.